Business Model Canvas PowerPoint Template: Complete Guide
Create a professional Business Model Canvas in PowerPoint. Learn all 9 building blocks with real examples from Uber, Airbnb, and Netflix plus step-by-step templates.
The Business Model Canvas is a strategic management template that visualizes how a company creates, delivers, and captures value—all on a single page. Developed by Alexander Osterwalder, it organizes a business model into nine interconnected building blocks: Customer Segments, Value Propositions, Channels, Customer Relationships, Revenue Streams, Key Resources, Key Activities, Key Partnerships, and Cost Structure.
If you're planning a startup, presenting to investors, running a strategy workshop, or analyzing competitors, the Business Model Canvas provides a structured format that forces clarity and enables strategic conversation.
This guide covers all nine building blocks with real examples from Uber, Airbnb, and Netflix, step-by-step PowerPoint creation instructions, common presentation mistakes, and techniques used at top consulting firms and Y Combinator startups.
After facilitating 150+ Business Model Canvas workshops for startups and corporate innovation teams, we've identified which building block sequences generate the sharpest insights and which presentation formats get stakeholder buy-in fastest.
What Is a Business Model Canvas?#
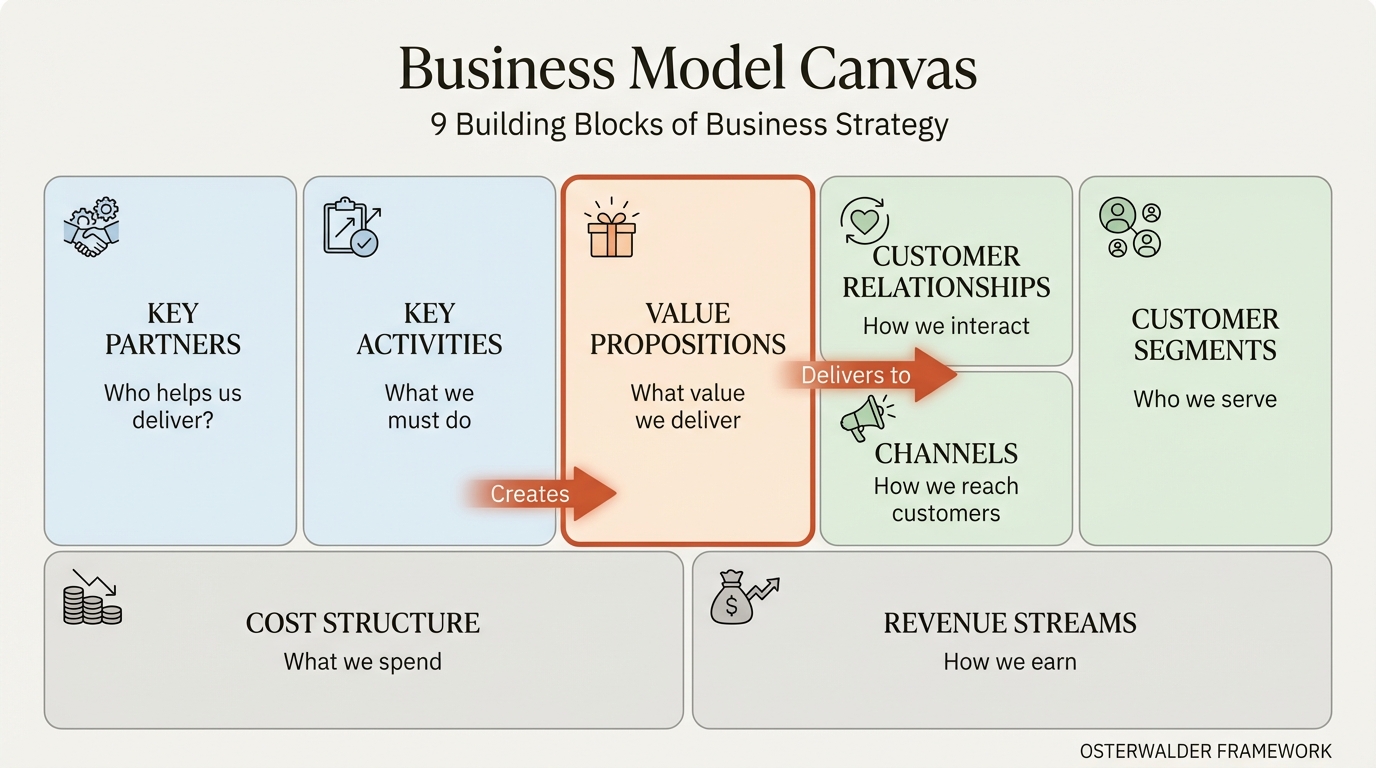
The Business Model Canvas is a strategic management template developed by Alexander Osterwalder and Yves Pigneur in their 2010 book Business Model Generation. It visualizes a company's business model on a single page through nine interconnected building blocks.
| Block | Category | Key Question |
|---|---|---|
| Customer Segments | Who | Who are we creating value for? |
| Value Propositions | What | What value do we deliver? |
| Channels | How | How do we reach customers? |
| Customer Relationships | How | How do we interact with customers? |
| Revenue Streams | How Much | How do we earn money? |
| Key Resources | What | What do we need to deliver value? |
| Key Activities | What | What must we do to deliver value? |
| Key Partnerships | Who | Who helps us deliver value? |
| Cost Structure | How Much | What does it cost to operate? |
The canvas divides into two sides: the right side focuses on value creation and delivery (customers, channels, relationships), while the left side focuses on value capture and operations (resources, activities, partners, costs). Value Propositions sit in the center, connecting both sides.
Why the Canvas Format Works#
Traditional business plans are linear documents. You read page one, then page two. But business models are not linear—they are systems of interconnected parts. Change your customer segment, and you may need different channels. Change your channels, and costs shift.
The canvas format captures these relationships visually. Everything fits on one page. Stakeholders see the whole picture at once. This enables better strategic conversations than any 50-page document.
According to Strategyzer's research, the Business Model Canvas has been used by over 5 million people and adopted by companies like GE, Mastercard, and Ericsson for strategic planning.
Business Model Canvas vs. Lean Canvas#
The Lean Canvas, created by Ash Maurya, adapts the original for early-stage startups:
| Business Model Canvas | Lean Canvas |
|---|---|
| Key Partners | Problem |
| Key Activities | Solution |
| Key Resources | Key Metrics |
| Customer Relationships | Unfair Advantage |
The Lean Canvas prioritizes problem-solution fit and assumes you are still validating your business model. The Business Model Canvas assumes you have a defined model and want to visualize or optimize it.
Use Business Model Canvas when: You have an established or well-defined business model to communicate, analyze, or present to stakeholders.
Use Lean Canvas when: You are in early startup mode, testing assumptions, and need to focus on problem-solution validation.
The 9 Building Blocks Explained#
Understanding each building block—and how they connect—is essential for creating an effective canvas. Let's examine each one with definitions, examples, and the questions that drive them.
1. Customer Segments#
Customer Segments define the different groups of people or organizations your business aims to serve. Without customers, no business survives.
Key questions:
- Who are we creating value for?
- What are our most important customer segments?
- Are we B2B, B2C, or a platform connecting multiple segments?
Types of customer segments:
| Type | Description | Example |
|---|---|---|
| Mass Market | Large group with similar needs | Consumer goods (P&G) |
| Niche Market | Specialized, narrow segment | Luxury watches (Patek Philippe) |
| Segmented | Distinct segments with different needs | Banking (retail vs. wealth management) |
| Diversified | Unrelated segments | Amazon (retail + AWS) |
| Multi-sided Platform | Two or more interdependent segments | Uber (riders and drivers) |
Real-world example: Netflix
Netflix serves multiple customer segments:
- Casual viewers (watch occasionally for entertainment)
- Binge-watchers (heavy users who consume content rapidly)
- Family households (multiple profiles, diverse preferences)
- International audiences (localized content, different languages)
Understanding these segments shapes everything from content investment to pricing tiers.
2. Value Propositions#
Value Propositions describe the bundle of products and services that create value for a specific Customer Segment. This is the reason customers choose you over competitors.
Key questions:
- What value do we deliver to the customer?
- Which customer problems are we solving?
- What needs are we satisfying?
- Why do customers choose us over alternatives?
Types of value creation:
| Value Type | Description | Example |
|---|---|---|
| Newness | Satisfies new needs | iPhone (first smartphone) |
| Performance | Improves product performance | Intel processors |
| Customization | Tailored to specific needs | Nike ID custom shoes |
| Getting the Job Done | Helps customers complete tasks | Salesforce for sales teams |
| Design | Superior aesthetic value | Apple products |
| Brand/Status | Status symbol | Rolex, Louis Vuitton |
| Price | Lower cost | Southwest Airlines |
| Cost Reduction | Helps customers reduce costs | AWS cloud computing |
| Risk Reduction | Reduces customer risk | Warranties, insurance |
| Accessibility | Makes products accessible | Microfinance |
| Convenience | Makes things easier | Uber vs. traditional taxis |
Real-world example: Airbnb
Airbnb's value propositions differ by segment:
For guests:
- Unique, authentic local experiences (not generic hotels)
- Often lower prices than traditional accommodation
- More space and amenities (kitchens, living areas)
- Access to non-traditional locations
For hosts:
- Earn income from unused space
- Flexibility to rent when convenient
- Insurance and host protection
- Platform handles payments and bookings
The canvas shows how one company delivers different value to different segments—essential for platform businesses.
3. Channels#
Channels describe how a company communicates with and reaches its Customer Segments to deliver its Value Proposition. Channels include communication, distribution, and sales channels.
Key questions:
- How do we reach our Customer Segments?
- Which channels work best?
- How are our channels integrated?
- Which channels are most cost-effective?
Channel phases:
| Phase | Purpose | Examples |
|---|---|---|
| Awareness | How do customers learn about us? | Advertising, PR, word-of-mouth |
| Evaluation | How do customers evaluate our value? | Reviews, demos, trials |
| Purchase | How do customers buy? | E-commerce, retail, sales team |
| Delivery | How do we deliver value? | Shipping, download, in-person |
| After-sales | How do we provide support? | Customer service, community |
Real-world example: Uber
Uber's channels are digital-first:
- Awareness: Word-of-mouth, referral programs, social media
- Evaluation: App ratings, price estimates, driver profiles
- Purchase: Mobile app (primary channel)
- Delivery: GPS-tracked rides, real-time updates
- After-sales: In-app support, rating system
The channel strategy directly supports the value proposition of convenience. Everything happens in the app. No phone calls, no cash, no waiting on street corners.
4. Customer Relationships#
Customer Relationships describe the types of relationships a company establishes with specific Customer Segments. Relationships range from personal to automated.
Key questions:
- What type of relationship does each segment expect?
- Which relationships have we established?
- How costly are they?
- How are they integrated with the rest of our business model?
Relationship types:
| Type | Description | Example |
|---|---|---|
| Personal Assistance | Human interaction | Luxury retail sales associates |
| Dedicated Personal Assistance | Assigned representative | Private banking |
| Self-Service | No direct relationship | Vending machines |
| Automated Services | Automated personalization | Netflix recommendations |
| Communities | Customer-to-customer | Apple user forums |
| Co-creation | Customers help create value | YouTube content creators |
Real-world example: Amazon
Amazon employs multiple relationship types:
- Self-service: Browse, search, purchase independently
- Automated: Personalized recommendations, order tracking
- Communities: Customer reviews and Q&A
- Personal assistance: Customer service for issues (phone, chat)
The balance minimizes cost (most interactions are automated) while providing human support when needed.
5. Revenue Streams#
Revenue Streams represent the cash a company generates from each Customer Segment. If customers are the heart of a business model, Revenue Streams are its arteries.
Key questions:
- For what value are customers willing to pay?
- How are they currently paying?
- How would they prefer to pay?
- How much does each revenue stream contribute to overall revenues?
Revenue types:
| Type | Description | Example |
|---|---|---|
| Asset Sale | Selling ownership rights | Retail products |
| Usage Fee | Pay per use | Cloud computing (AWS) |
| Subscription | Recurring access fee | Netflix, Spotify |
| Licensing | Permission to use IP | Microsoft software licenses |
| Brokerage Fees | Intermediation services | Real estate agents |
| Advertising | Attention-based revenue | Google, Facebook |
| Freemium | Free basic, paid premium | Dropbox, Slack |
Pricing mechanisms:
| Fixed Pricing | Dynamic Pricing |
|---|---|
| List price | Negotiation |
| Volume-dependent | Yield management |
| Segment-dependent | Real-time market |
| Feature-dependent | Auctions |
Real-world example: Spotify
Spotify combines multiple revenue streams:
- Freemium subscriptions: Free ad-supported tier converts to paid ($10.99/month)
- Premium tiers: Individual, Duo, Family, Student pricing
- Advertising: Revenue from free-tier users
- Podcast revenue: Exclusive content and advertising
The freemium model builds the user base; subscriptions generate the majority of revenue. This dual approach is visible on the canvas and explains strategic priorities.
6. Key Resources#
Key Resources describe the most important assets required to make a business model work. Different business models require different resources.
Key questions:
- What Key Resources do our Value Propositions require?
- Our Distribution Channels? Customer Relationships?
- Revenue Streams?
Resource categories:
| Category | Description | Example |
|---|---|---|
| Physical | Facilities, equipment, inventory | Manufacturing plants, retail stores |
| Intellectual | Patents, brands, proprietary knowledge | Pharmaceutical patents, brand equity |
| Human | Specialized expertise, creativity | Consulting firms, design agencies |
| Financial | Cash, credit lines, stock options | Banks, startups with funding |
Real-world example: Uber
Uber's key resources are notably different from traditional transportation:
- Intellectual: Proprietary matching algorithms, brand
- Human: Engineering talent, data scientists
- Physical: Minimal (no vehicle fleet—this is the disruption)
- Financial: Venture capital for growth and subsidies
Notice what's missing: Uber owns almost no physical assets. The canvas reveals how platform businesses operate asset-light, which fundamentally changes cost structure and scalability.
7. Key Activities#
Key Activities describe the most important things a company must do to make its business model work. Like Key Resources, they are required to create and deliver Value Propositions.
Key questions:
- What Key Activities do our Value Propositions require?
- Our Distribution Channels?
- Customer Relationships?
- Revenue Streams?
Activity categories:
| Category | Description | Example |
|---|---|---|
| Production | Designing, making, delivering | Manufacturing companies |
| Problem Solving | Finding solutions for customers | Consulting firms, hospitals |
| Platform/Network | Maintaining and developing platforms | eBay, Visa, Software platforms |
Real-world example: Netflix
Netflix's key activities:
- Content acquisition: Licensing third-party content
- Content production: Original series and films
- Platform development: Streaming technology, apps
- Recommendation algorithms: Personalization engine
- Global expansion: Localization, international content
The shift from content acquisition to content production was a strategic pivot visible in how Key Activities evolved over time.
8. Key Partnerships#
Key Partnerships describe the network of suppliers and partners that make the business model work. Companies form partnerships to optimize operations, reduce risk, or acquire resources.
Key questions:
- Who are our Key Partners?
- Who are our Key Suppliers?
- Which Key Resources are we acquiring from partners?
- Which Key Activities do partners perform?
Partnership types:
| Type | Purpose | Example |
|---|---|---|
| Strategic Alliance | Non-competitors working together | Starbucks + Barnes & Noble |
| Coopetition | Competitors partnering | Samsung supplying Apple displays |
| Joint Ventures | New business together | Sony Ericsson (historical) |
| Buyer-Supplier | Reliable supply | Apple and Foxconn |
Partnership motivations:
- Optimization and economies of scale: Reduce costs by outsourcing
- Reduction of risk and uncertainty: Share development risks
- Acquisition of resources and activities: Access capabilities you lack
Real-world example: Airbnb
Airbnb's key partnerships:
- Payment processors: Stripe, PayPal for secure transactions
- Insurance providers: Host protection and liability coverage
- Local service providers: Cleaning, property management
- Tourism boards: Destination marketing partnerships
- Photography services: Professional listing photos
These partnerships enable Airbnb to deliver value without building every capability in-house.
9. Cost Structure#
Cost Structure describes all costs incurred to operate a business model. Creating value, maintaining Customer Relationships, and generating revenue all incur costs.
Key questions:
- What are the most important costs inherent in our business model?
- Which Key Resources are most expensive?
- Which Key Activities are most expensive?
Cost structure types:
| Type | Focus | Example |
|---|---|---|
| Cost-Driven | Minimize costs wherever possible | Budget airlines (Ryanair) |
| Value-Driven | Premium value, less cost focus | Luxury brands |
Cost characteristics:
| Characteristic | Description | Example |
|---|---|---|
| Fixed Costs | Don't vary with volume | Salaries, rent, equipment |
| Variable Costs | Vary with volume | Materials, commissions |
| Economies of Scale | Cost advantages from volume | Manufacturing |
| Economies of Scope | Cost advantages from range | Amazon using logistics for multiple product categories |
Real-world example: Netflix
Netflix's cost structure:
- Content costs: Largest expense (billions annually)
- Technology infrastructure: Streaming platform, AWS costs
- Marketing: Customer acquisition and retention
- Personnel: Engineering, content teams, corporate
- Licensing fees: Third-party content rights
Netflix is value-driven, not cost-driven. The cost structure supports the value proposition of extensive, high-quality content.
Continue reading: Bullet Charts in PowerPoint · Deloitte Presentation Template · Traction Slide
Build consulting slides in seconds
Describe what you need. AI generates structured, polished slides — charts and visuals included.
Business Model Canvas Examples#
Seeing complete canvases illuminates how the nine blocks connect. Here are three examples from well-known companies.
Example 1: Uber Business Model Canvas#
| Block | Content |
|---|---|
| Customer Segments | Riders (urban commuters, travelers, nightlife), Drivers (part-time income, flexible work) |
| Value Propositions | Riders: Convenience, reliability, cashless, price transparency. Drivers: Flexible income, easy onboarding |
| Channels | Mobile app (primary), website, word-of-mouth, referral programs |
| Customer Relationships | Automated (app-based), rating system, 24/7 support |
| Revenue Streams | Commission per ride (20-25%), surge pricing, Uber Eats, freight services |
| Key Resources | Technology platform, brand, driver network, data/algorithms |
| Key Activities | Platform development, driver recruitment, regulatory navigation, marketing |
| Key Partnerships | Drivers (contractors), payment processors, mapping providers (Google), vehicle financing partners |
| Cost Structure | Platform development, driver incentives, marketing, legal/regulatory, customer support |
Strategic insight: Uber's canvas reveals the platform model—minimal physical assets, two-sided value creation, and network effects as the primary moat.
Example 2: Airbnb Business Model Canvas#
| Block | Content |
|---|---|
| Customer Segments | Guests (budget travelers, experience seekers, business travelers), Hosts (property owners, spare room renters) |
| Value Propositions | Guests: Unique spaces, local experience, often lower cost. Hosts: Income from unused space, flexibility, insurance |
| Channels | Website, mobile app, SEO, social media, PR, travel partnerships |
| Customer Relationships | Self-service booking, automated messaging, review system, host community |
| Revenue Streams | Guest service fee (up to 14.2%), host fee (3%), experiences revenue |
| Key Resources | Platform technology, brand trust, host/guest network, review database |
| Key Activities | Platform maintenance, trust and safety, customer support, regulatory affairs, community building |
| Key Partnerships | Hosts, payment processors, insurance providers, photography services, tourism boards |
| Cost Structure | Technology development, customer support, trust and safety, marketing, legal |
Strategic insight: Trust is central to Airbnb's model. The review system, insurance partnerships, and verification processes all build trust—essential when strangers stay in each other's homes.
Example 3: Netflix Business Model Canvas#
| Block | Content |
|---|---|
| Customer Segments | Casual viewers, binge-watchers, families, international audiences (190+ countries) |
| Value Propositions | Unlimited content, no ads (standard tier), personalized recommendations, original content, multi-device access |
| Channels | Website, apps (TV, mobile, tablet), smart TV integrations, gaming consoles |
| Customer Relationships | Automated personalization, self-service, social features (profiles), email engagement |
| Revenue Streams | Monthly subscriptions (Basic, Standard, Premium), ad-supported tier revenue |
| Key Resources | Content library (licensed + original), recommendation algorithm, streaming technology, brand |
| Key Activities | Content production, content licensing, platform development, algorithm optimization, global expansion |
| Key Partnerships | Content studios, device manufacturers, ISPs, production companies, talent agencies |
| Cost Structure | Content (largest), technology infrastructure, marketing, personnel, licensing |
Strategic insight: Netflix's pivot from licensing to production is visible in Key Activities. Original content (Key Resources) creates differentiation that licensed content cannot provide.
How to Create a Business Model Canvas in PowerPoint#
Now for the practical part: building a professional Business Model Canvas in PowerPoint.
Method 1: Manual Shape Creation#
The hands-on approach gives full control over design.
Step 1: Set up the grid
- Create a new slide with blank layout
- Insert a large rectangle covering most of the slide
- Add vertical lines to create three columns (left: 2 blocks, center: 2 blocks, right: 3 blocks)
- Add horizontal lines to separate blocks within columns
Step 2: Create the standard layout
The traditional canvas layout:
+------------------+------------------+------------------+
|                  |                  | Customer         |
| Key Partners     | Key Activities   | Relationships    |
|                  +------------------+------------------+
|                  |                  | Customer         |
+------------------+ Value            | Segments         |
|                  | Propositions     +------------------+
| Key Resources    |                  | Channels         |
|                  |                  |                  |
+------------------+------------------+------------------+
|        Cost Structure               | Revenue Streams  |
+------------------+------------------+------------------+
Step 3: Format each block
- Use a light fill color for each section
- Add block titles in bold at the top of each section
- Insert text boxes for content items
- Consider using sticky-note style boxes for a workshop feel
Time estimate: 30-45 minutes for a polished canvas
Method 2: PowerPoint SmartArt#
SmartArt offers faster creation but less flexibility.
Steps:
- Insert > SmartArt > Matrix or Hierarchy options
- Customize the layout to approximate the canvas structure
- Note: Standard SmartArt doesn't perfectly match the 9-block layout
Limitation: SmartArt works for simple diagrams but struggles with the asymmetric canvas layout. Most professionals prefer shapes.
Method 3: PowerPoint Add-ins#
Add-ins like Deckary streamline framework creation with pre-built templates and alignment tools.
Benefits of using add-ins:
- Pre-formatted canvas templates
- Consistent styling across presentations
- Quick alignment with keyboard shortcuts
- Icon library for visual enhancement
Deckary's alignment shortcuts are particularly useful for canvas creation. Distributing nine blocks evenly and maintaining consistent spacing is tedious manually. Keyboard shortcuts for horizontal and vertical distribution solve this in seconds.
| Method | Time | Flexibility | Best For |
|---|---|---|---|
| Manual shapes | 30-45 min | High | Custom branding, one-time use |
| SmartArt | 10-15 min | Low | Quick drafts |
| Deckary | 5-10 min | High | Regular framework creation |
Formatting Best Practices#
Colors:
- Use a consistent color scheme (2-3 colors maximum)
- Consider color-coding by category: customer-facing (blue), operations (green), financials (orange)
- Light fills with darker borders maintain readability
Typography:
- Block titles: Bold, 12-14pt
- Content items: Regular, 10-12pt
- Keep text concise—bullets, not paragraphs
Layout:
- Maintain consistent spacing between blocks
- Leave white space within blocks for readability
- Use icons to represent concepts visually (see free PowerPoint icons)
Alignment: Following consulting slide standards:
- All blocks should align precisely
- Margins should be consistent
- Text alignment should be uniform
For alignment efficiency, PowerPoint alignment shortcuts reduce formatting time significantly.
Business Model Canvas Best Practices#
After creating hundreds of canvases in consulting and startup contexts, these practices consistently improve quality.
Focus on Connections, Not Just Boxes#
The canvas isn't nine independent boxes—it's a system. When presenting, show how blocks connect:
- Customer Segments determine which Channels you need
- Value Propositions must match what Segments want
- Key Activities must deliver the Value Proposition
- Cost Structure reflects Resources, Activities, and Partnerships
Example connection: "Our Customer Segment is enterprise IT teams. They evaluate through procurement processes, so our Channel includes sales teams and RFP responses. This relationship type drives our Cost Structure—sales personnel are our largest expense."
Be Specific and Evidence-Based#
| Weak | Strong |
|---|---|
| "Various customer segments" | "Enterprise IT teams at companies with 500+ employees" |
| "Multiple revenue streams" | "SaaS subscriptions: $500/month average, 85% of revenue" |
| "Strong partnerships" | "Exclusive AWS partnership for cloud infrastructure" |
Vague canvases are useless. Specificity creates actionable strategy.
Update Regularly#
Business models evolve. Netflix's canvas in 2010 (DVD mail delivery) looks nothing like 2024 (streaming original content).
Review cadence:
- Quarterly: Quick review for material changes
- Annually: Full canvas refresh
- Event-driven: Major pivots, new products, market shifts
Use for Workshops, Not Just Presentations#
The canvas format is designed for collaborative completion. In workshops:
- Use sticky notes on a large canvas
- Have team members fill blocks independently, then compare
- Identify gaps and conflicts in understanding
- Build alignment on business model priorities
This workshop approach often reveals that executives have different mental models of the same business. The canvas forces alignment.
Common BMC Presentation Mistakes#
These errors appear repeatedly. Avoid them, and your canvas will outperform most.
Mistake 1: Treating Blocks as Independent#
Problem: Filling each block without considering connections.
Fix: After completing the canvas, draw arrows or lines showing how blocks relate. In your presentation, explicitly discuss connections.
Mistake 2: Being Too Vague#
Problem: Generic descriptions that could apply to any company.
Fix: Apply the competitor test—if a competitor could copy your canvas word-for-word, you're not specific enough.
Mistake 3: Listing Features, Not Value#
Problem: Value Propositions that list product features rather than customer value.
Fix: For each "feature," ask "so what?" until you reach actual customer benefit.
| Feature (Wrong) | Value (Right) |
|---|---|
| "AI-powered analytics" | "Reduce reporting time from 4 hours to 10 minutes" |
| "Mobile app" | "Book rides from anywhere in 30 seconds" |
| "24/7 support" | "Never wait more than 2 minutes for help" |
Mistake 4: Ignoring Cost Structure Details#
Problem: Vague cost descriptions like "operational costs" or "technology expenses."
Fix: Identify the 3-5 largest cost drivers specifically. For Netflix: "Content investment ($15B+), technology infrastructure, marketing." This specificity reveals strategic priorities.
Mistake 5: Mismatched Segments and Propositions#
Problem: Value Propositions that don't clearly map to Customer Segments.
Fix: For each segment, explicitly state which value propositions matter to them. Different segments want different things.
Mistake 6: Static Presentation#
Problem: Presenting the canvas as a fixed picture rather than a dynamic model.
Fix: Show how the model might evolve. What happens if you add a new segment? What if costs shift? Dynamic thinking demonstrates strategic depth.
Mistake 7: Overcrowding the Canvas#
Problem: Cramming every detail into every block.
Fix: The canvas is a summary, not a comprehensive document. Each block should have 3-5 key items maximum. Supporting detail lives in backup slides.
Using Deckary for Business Model Canvas Creation#
Creating a professional Business Model Canvas requires precise alignment of nine blocks with consistent formatting. This is where PowerPoint add-ins add significant value.
Alignment Shortcuts#
Deckary's keyboard shortcuts for alignment and distribution solve the most tedious part of canvas creation:
- Distribute horizontally: Space blocks evenly across the slide
- Distribute vertically: Equal spacing top to bottom
- Align edges: Perfect alignment on any edge
What takes 10 minutes of manual adjustment takes seconds with keyboard shortcuts.
Icon Library#
The 600+ icon library in Deckary includes business and strategy icons useful for canvas visualization:
- Customer icons for segments
- Gear icons for activities
- Handshake icons for partnerships
- Money icons for revenue and costs
Icons make canvases more visually engaging and scannable.
Integration with Other Frameworks#
Business Model Canvas often appears alongside other strategic frameworks:
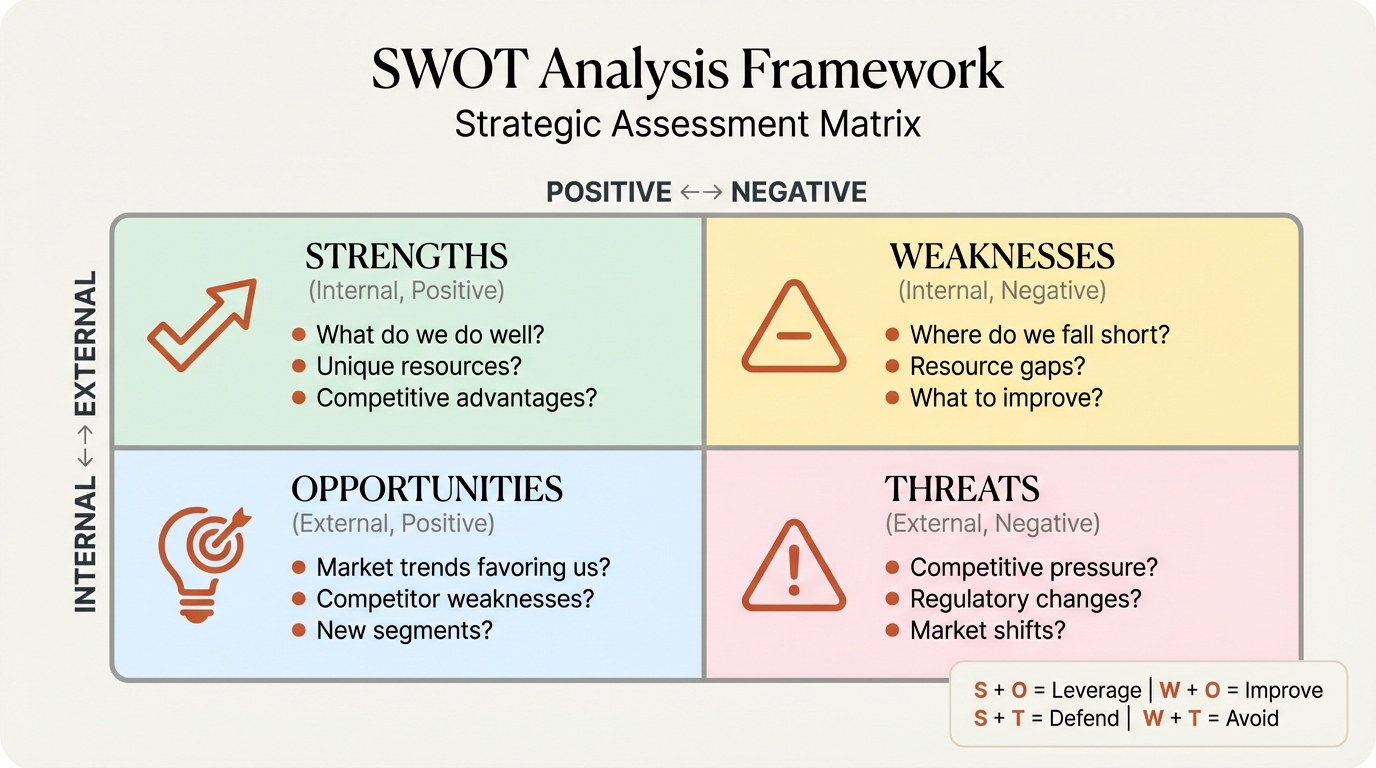
- SWOT Analysis to assess internal and external factors
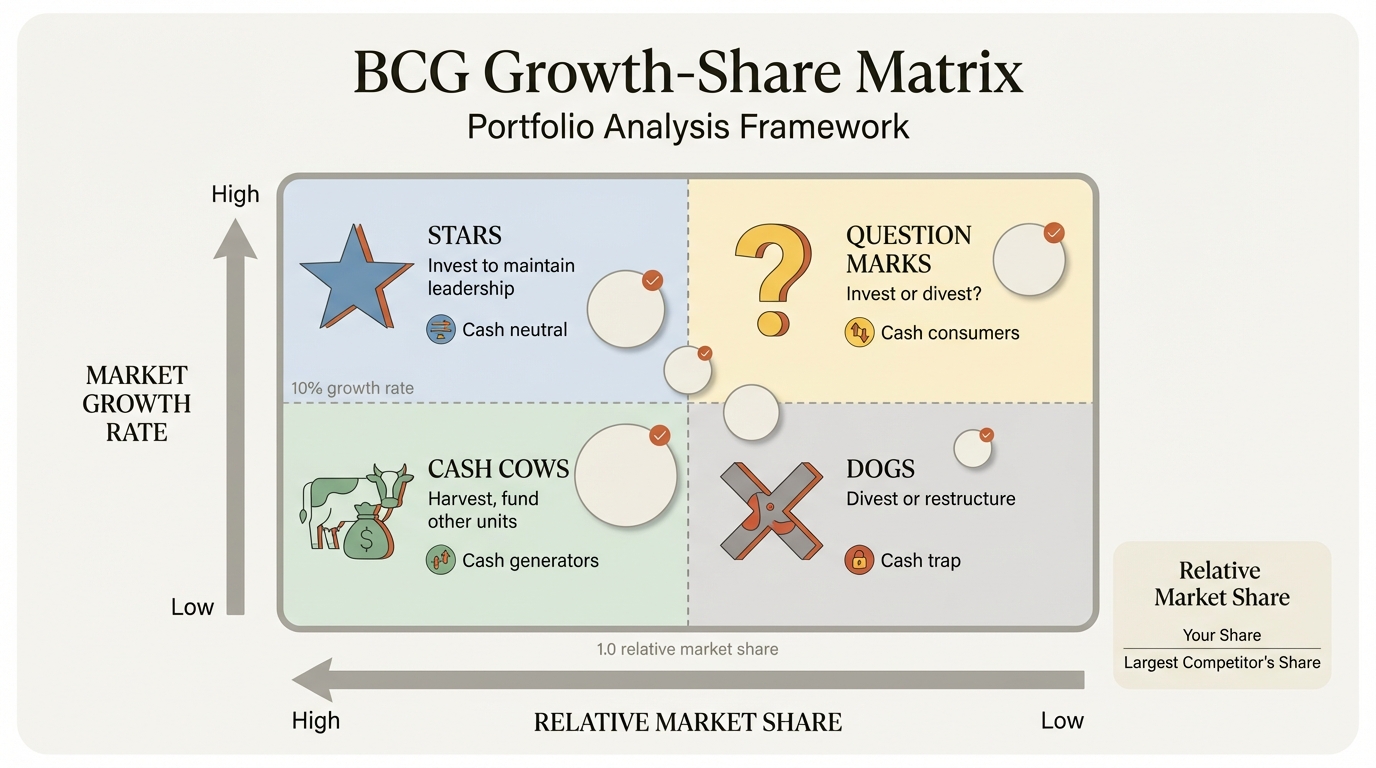
- BCG Matrix for portfolio analysis
- Porter's Five Forces for industry analysis
- Pitch Deck Template structure for investor presentations
Having consistent formatting across frameworks creates professional, cohesive presentations.
Business Model Canvas vs. Other Frameworks#
Understanding when to use the Business Model Canvas versus alternatives improves strategic analysis.
BMC vs. Lean Canvas#
| Dimension | Business Model Canvas | Lean Canvas |
|---|---|---|
| Creator | Alexander Osterwalder | Ash Maurya |
| Focus | Complete business model | Startup validation |
| Unique blocks | Partners, Activities, Resources, Relationships | Problem, Solution, Metrics, Unfair Advantage |
| Best for | Established businesses, comprehensive view | Early-stage startups, hypothesis testing |
| Assumption | Business model is defined | Business model is being discovered |
Use BMC when: Presenting to investors, analyzing competitors, strategic planning sessions.
Use Lean Canvas when: Pre-product stage, running experiments, validating problem-solution fit.
BMC vs. SWOT Analysis#
| Dimension | Business Model Canvas | SWOT Analysis |
|---|---|---|
| Purpose | Visualize business model | Assess strategic position |
| Scope | How the business works | Company strengths and weaknesses |
| External factors | Implicit in segments, channels | Explicit in Opportunities/Threats |
| Best for | Model communication | Strategy formulation |
These frameworks complement each other. Use BMC to describe the model; use SWOT to evaluate it.
BMC vs. Value Proposition Canvas#
The Value Proposition Canvas, also by Osterwalder, zooms into two BMC blocks: Customer Segments and Value Propositions. Use it when you need deeper customer understanding before completing the full BMC.
Combining Frameworks#
Effective strategic analysis combines multiple frameworks:
- BMC to visualize the current or proposed business model
- SWOT to assess internal capabilities and external environment
- Porter's Five Forces to analyze industry attractiveness
- Financial analysis to validate revenue and cost assumptions
The BMC provides the "what"—what is the business model? Other frameworks provide the "so what"—is this model viable?
Summary#
The Business Model Canvas remains one of the most powerful tools for visualizing and communicating how a business creates, delivers, and captures value. Its single-page format forces clarity and enables strategic conversations that linear documents cannot.
Key principles:
-
Nine interconnected blocks: Customer Segments, Value Propositions, Channels, Customer Relationships, Revenue Streams, Key Resources, Key Activities, Key Partnerships, and Cost Structure
-
Right side = value creation: Customer-facing elements that deliver value
-
Left side = value capture: Operational elements that enable delivery
-
Center = Value Proposition: The bridge connecting what you offer to who you serve
-
Connections matter more than boxes: Show how changes in one block affect others
-
Specificity creates value: "Enterprise IT teams at 500+ employee companies" beats "various customers"
-
Update regularly: Business models evolve; your canvas should too
For PowerPoint execution:
- Use the standard 9-block layout for recognition
- Maintain consistent formatting and alignment
- Consider add-ins like Deckary for faster creation
- Keep content concise—3-5 items per block maximum
- Use icons and colors strategically
The Business Model Canvas works because it makes the invisible visible. Complex business models that would take pages to describe become clear on a single slide. That clarity enables better decisions, better communication, and better strategy.
That startup founder who walked into our workshop with 47 pages? Her single-slide canvas didn't just help her get funded. It helped her team align on priorities, helped investors understand the opportunity, and helped her identify gaps in her model that the 47 pages had hidden.
Sometimes less is more. The Business Model Canvas proves it.
Ready to build professional strategy frameworks faster? Deckary includes alignment shortcuts, icon libraries, and charting tools that help consultants and founders create compelling presentations. Start your free 14-day trial—no credit card required.
Build consulting slides in seconds
Describe what you need. AI generates structured, polished slides — charts and visuals included.
Try Free