OKR Template PowerPoint: How to Present Goals & Key Results
OKR template for PowerPoint presentations. Learn how to create compelling OKR slides with examples, layouts, and best practices for quarterly reviews.
OKRs (Objectives and Key Results) are a goal-setting framework that defines ambitious objectives and the measurable outcomes that indicate success. An OKR template for PowerPoint provides structured layouts for presenting these goals, tracking progress visually, and reporting on quarterly performance.
According to research from OKRs Tool, teams that conduct weekly check-ins achieve 43% higher goal completion than those reviewing OKRs only quarterly. But those check-ins require clear, actionable slides that stakeholders can absorb in seconds—not overcrowded templates that obscure whether you're winning or losing.
This guide covers how to build OKR templates in PowerPoint that drive alignment and action: the layouts that work, progress visualization techniques, and common presentation mistakes to avoid.
After designing OKR presentations for 45+ quarterly reviews across startups and enterprises, we've measured which slide formats actually drive accountability versus those that become status theater. The patterns hold regardless of company stage or industry.
What Are OKRs (Objectives and Key Results)?#
OKRs are a goal-setting framework that defines ambitious objectives and the measurable outcomes that indicate success. Developed at Intel and popularized by Google, the methodology has become standard practice at high-growth organizations.
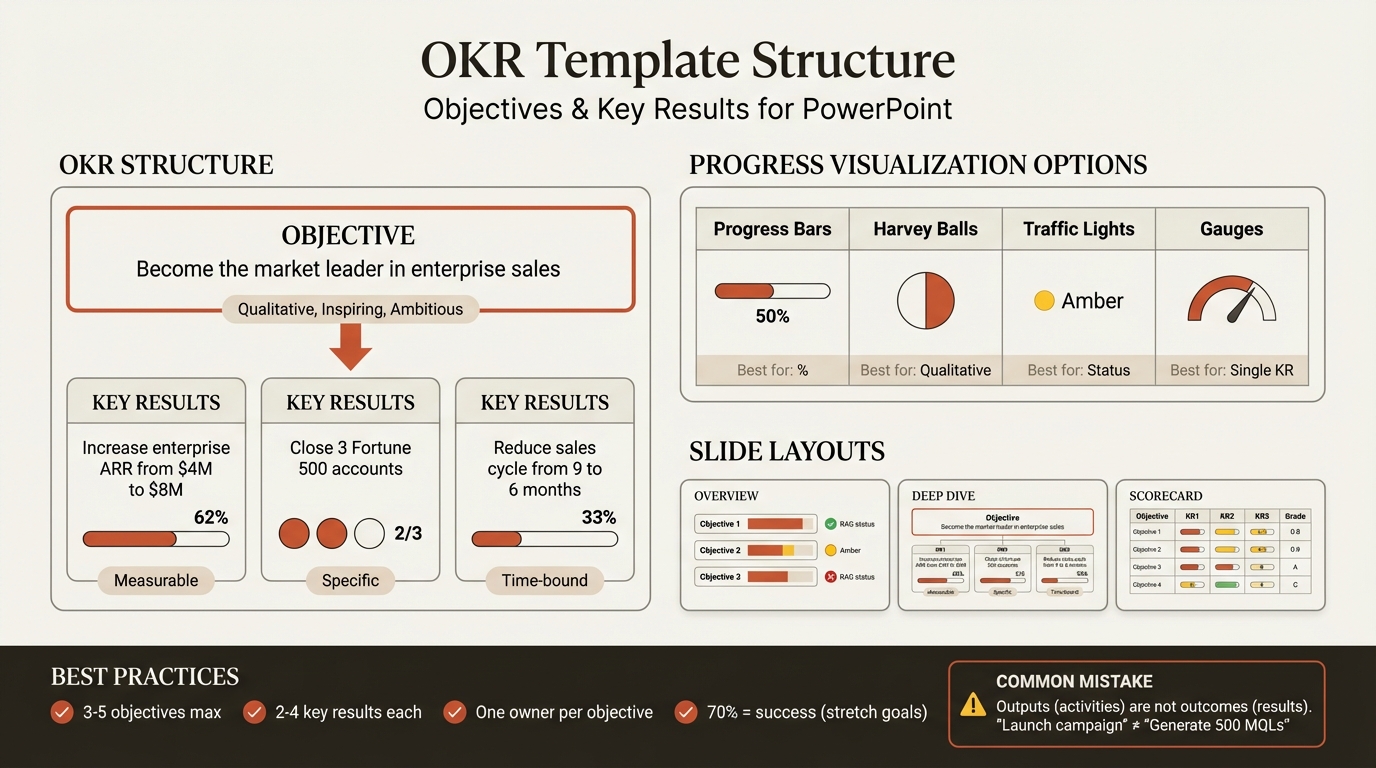
The OKR Structure#
| Component | Definition | Example |
|---|---|---|
| Objective | Qualitative goal that's inspiring and ambitious | "Become the market leader in enterprise sales" |
| Key Result 1 | Measurable outcome that proves progress | "Increase enterprise ARR from $4M to $8M" |
| Key Result 2 | Measurable outcome that proves progress | "Close 3 Fortune 500 accounts" |
| Key Result 3 | Measurable outcome that proves progress | "Reduce enterprise sales cycle from 9 to 6 months" |
Objectives answer "what do we want to achieve?" Key results answer "how will we know we achieved it?"
Why OKRs Work#
The framework creates focus by limiting priorities. According to the 2026 OKR Benchmark Report, teams that simplify their OKR scope complete 38% more key results on average than those juggling five or more objectives. Best practice is keeping your OKRs to what fits on a single dashboard.
| OKR Characteristic | Impact on Organization |
|---|---|
| Ambitious targets | Stretches performance beyond comfort zone |
| Measurable outcomes | Removes ambiguity about success |
| Time-bound (quarterly) | Creates urgency and rhythm |
| Transparent to all | Promotes alignment and accountability |
| Limited in number | Forces prioritization |
Research from Synergita confirms that OKRs should be public--everyone should be able to see everyone else's OKRs. This transparency promotes teamwork, communication, and cross-functional understanding.
Why Present OKRs in PowerPoint?#
While OKR software tools exist, PowerPoint remains the preferred format for executive presentations, team meetings, and cross-functional alignment sessions.
When PowerPoint OKR Templates Excel#
| Use Case | Why PowerPoint |
|---|---|
| Board presentations | Integrated with other strategic slides |
| All-hands meetings | Familiar format for large audiences |
| Quarterly business reviews | Part of comprehensive performance decks |
| Cross-functional alignment | Shareable without software licenses |
| Investor updates | Professional, polished output |
When to Use OKR Software Instead#
Dedicated OKR tools like Weekdone, Gtmhub, or Lattice work better for:
- Real-time progress tracking
- Individual contributor updates
- Continuous check-ins between meetings
- Cascading OKRs across large organizations
The ideal approach combines both: software for ongoing tracking, PowerPoint for periodic presentations and alignment discussions.
OKR Template Structure for PowerPoint#
An effective OKR presentation follows a logical structure that builds understanding and drives action.
Recommended Slide Sequence#
| Slide Type | Purpose | When to Use |
|---|---|---|
| OKR Overview | Show all objectives at a glance | Every OKR presentation |
| Objective Deep Dive | Detail one objective with all key results | When explaining new OKRs or reviewing progress |
| Progress Dashboard | Visual status of all key results | Weekly/monthly check-ins |
| Variance Analysis | Explain gaps and recovery plans | When results deviate from targets |
| Quarterly Scorecard | Final assessment with grades | End-of-quarter reviews |
| Next Quarter OKRs | Proposed objectives going forward | Planning presentations |
The OKR Overview Slide#
This slide provides the executive summary--all objectives visible at once with high-level status.
Structure:
+--------------------------------------------------+
|  Q1 2026 OKRs: [Team/Company Name]               |
+--------------------------------------------------+
|                                                  |
|  Objective 1: [Title]          [Status: Green]   |
|  3 Key Results | 67% Complete                    |
|                                                  |
|  Objective 2: [Title]          [Status: Yellow]  |
|  4 Key Results | 45% Complete                    |
|                                                  |
|  Objective 3: [Title]          [Status: Green]   |
|  3 Key Results | 82% Complete                    |
|                                                  |
+--------------------------------------------------+
Design principles:
- Maximum 5 objectives per slide
- Traffic light status (green/yellow/red)
- Aggregate completion percentage
- Key result count for context
The Objective Deep Dive Slide#
This slide expands on a single objective with all key results and progress details.
Structure:
+--------------------------------------------------+
|  Objective: Become the market leader in          |
|  enterprise sales                                |
+--------------------------------------------------+
|                                                  |
|  KR1: Increase enterprise ARR from $4M to $8M    |
|  [==========>          ] 62% | $4.96M actual     |
|                                                  |
|  KR2: Close 3 Fortune 500 accounts               |
|  [================     ] 67% | 2 of 3 closed     |
|                                                  |
|  KR3: Reduce sales cycle from 9 to 6 months      |
|  [=====                ] 33% | 8.1 months actual |
|                                                  |
+--------------------------------------------------+
|  Owner: VP Sales | Due: March 31, 2026           |
+--------------------------------------------------+
Key elements:
- Clear objective statement at top
- Each key result with target and actual values
- Visual progress indicator
- Owner and timeline at bottom
Best Slide Layouts for OKRs#
Different layouts work for different OKR presentation contexts. Here are the four most effective approaches.
Layout 1: The Cascade View#
Shows how company objectives flow down to department and team objectives.
Best for: All-hands meetings, demonstrating alignment, new employee orientation
Structure:
Company Objective: Achieve $100M ARR
         |
    +---------+---------+
    |         |         |
  Sales    Product   Marketing
  OKRs      OKRs       OKRs
This layout reinforces that individual efforts connect to organizational goals. Gartner research shows that when individual goals align with organizational needs, employee performance can improve by 22%.
Layout 2: The Progress Grid#
Shows all key results in a compact matrix with status indicators.
Best for: Weekly check-ins, status updates, team meetings
| Objective | Key Result | Target | Actual | Status |
|---|---|---|---|---|
| Market leader | Enterprise ARR | $8M | $4.96M | Yellow |
| Market leader | F500 accounts | 3 | 2 | Green |
| Market leader | Sales cycle | 6 mo | 8.1 mo | Red |
| Product excellence | NPS score | 60 | 58 | Yellow |
| Product excellence | Feature releases | 12 | 9 | Green |
Design tips:
- Color the status column with traffic light colors
- Right-align numeric values for easy comparison
- Bold key results that need attention
Layout 3: The Scorecard#
Shows final grades at the end of a quarter with learning insights.
Best for: Quarterly reviews, retrospectives, planning sessions
| Objective | Final Score | Grade | Key Learning |
|---|---|---|---|
| Market leader in enterprise | 62% | B- | Pipeline quality > volume |
| Product excellence | 78% | A- | Customer feedback loops working |
| Team growth | 45% | C | Hiring timeline underestimated |
Scoring convention:
- 70%+ = Success (stretch goals rarely hit 100%)
- 50-70% = Partial success
- Below 50% = Needs investigation
The OKR methodology expects 60-70% achievement on ambitious goals. Quantive's OKR Guide notes that consistently hitting 100% indicates your objectives aren't ambitious enough.
Layout 4: The Variance Analysis#
Explains why key results are off track and what corrective action is planned.
Best for: Monthly reviews, steering committees, recovery planning
Structure:
+--------------------------------------------------+
|  KR: Reduce sales cycle from 9 to 6 months       |
|  Status: At Risk (Red)                           |
+--------------------------------------------------+
|  Target: 6 months | Actual: 8.1 months | Gap: 35%|
+--------------------------------------------------+
|  Root Cause Analysis:                            |
|  - Legal review adding 3 weeks per deal          |
|  - Procurement complexity at F500 accounts       |
+--------------------------------------------------+
|  Recovery Actions:                               |
|  - Pre-approved contract templates (Jan 15)      |
|  - Dedicated enterprise legal resource (Jan 20)  |
+--------------------------------------------------+
Continue reading: Bullet Charts in PowerPoint · Deloitte Presentation Template · Traction Slide
Build consulting slides in seconds
Describe what you need. AI generates structured, polished slides — charts and visuals included.
How to Visualize OKR Progress#
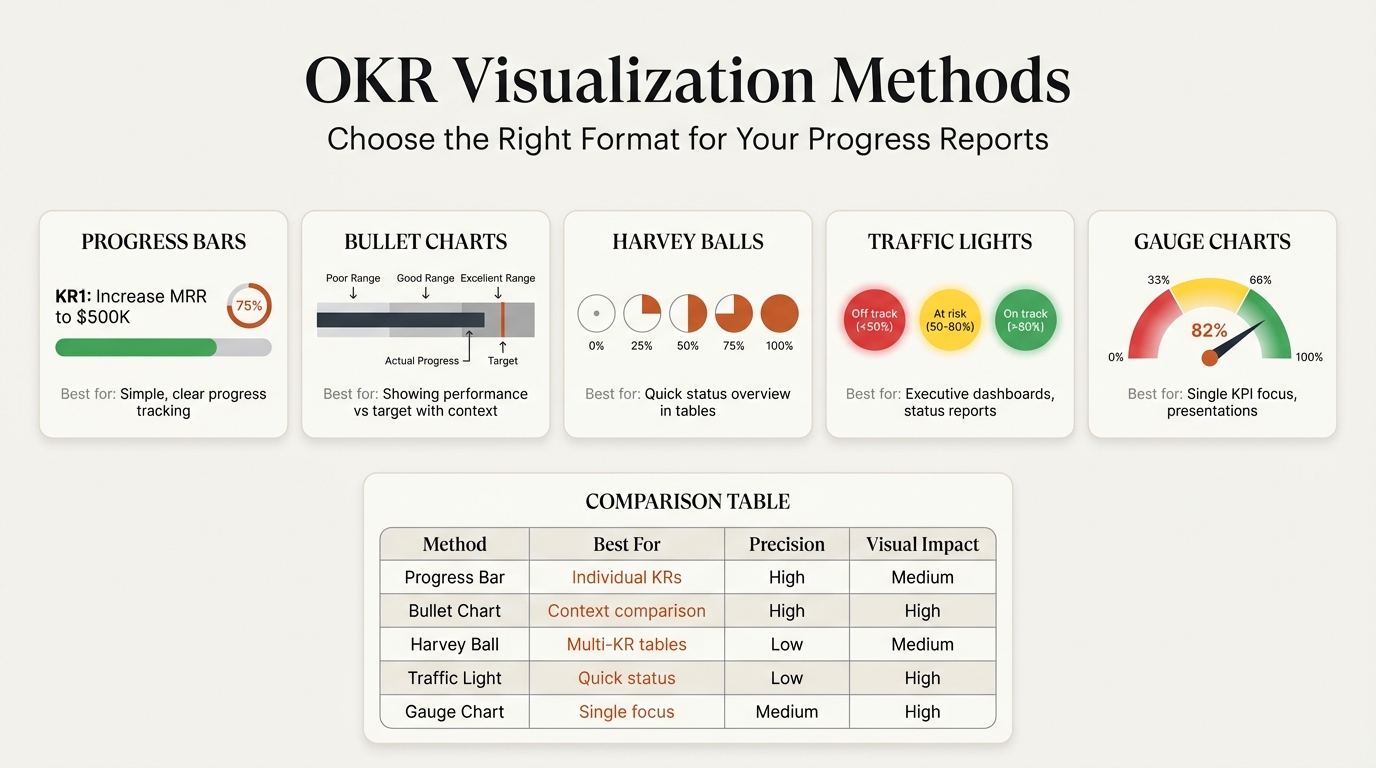
The right visualization makes status instantly clear. Match the chart type to the data story.
Progress Bars#
Best for: Percentage completion toward a target
KR: Increase enterprise ARR to $8M
[================>            ] 62%
$4M start | $4.96M actual | $8M target
Design tips:
- Use brand colors for the filled portion
- Gray for the remaining portion
- Show start, actual, and target values below
Bullet Charts#
Best for: Comparing actual performance against targets with ranges
Bullet charts show actual values as bars against target markers, with background ranges indicating poor, acceptable, and good performance zones. This is particularly effective for financial metrics.
Deckary and other charting add-ins create bullet charts directly in PowerPoint, making OKR progress visualization faster than building from shapes.
Harvey Balls#
Best for: Qualitative status across multiple items
| Key Result | Q1 | Q2 | Q3 | Q4 |
|---|---|---|---|---|
| Enterprise ARR | Half | Three-quarters | Full | - |
| F500 accounts | Quarter | Half | Three-quarters | - |
| Sales cycle | Empty | Quarter | Half | - |
Harvey balls work well when exact percentages matter less than relative progress. See our Harvey balls in PowerPoint guide for implementation details.
Traffic Light Status#
Best for: Quick status communication at a glance
| Status | Meaning | When to Use |
|---|---|---|
| Green | On track (above 70% of target trajectory) | Progress matches or exceeds plan |
| Yellow | At risk (50-70% of trajectory) | Intervention may be needed |
| Red | Off track (below 50% of trajectory) | Immediate action required |
Gauge Charts#
Best for: Single key result focus, executive dashboards
Gauge charts (speedometer-style) show progress toward a single target with clear zones. They work well for hero metrics but consume too much space for multiple key results.
For creating gauges and other OKR visualizations, tools like Deckary offer consulting-quality charts that link to Excel for automatic updates when actuals change.
OKR Examples by Department#
Different functions have different objective types. Here are examples structured for PowerPoint presentation.
Sales OKRs#
| Objective | Key Results | Metric Type |
|---|---|---|
| Dominate enterprise segment | Increase enterprise ARR from $4M to $8M | Revenue |
| Close 5 new Fortune 500 accounts | Count | |
| Reduce sales cycle from 9 to 6 months | Time | |
| Achieve 40% win rate on deals >$100K | Percentage | |
| Build world-class sales team | Hire 8 enterprise AEs by Q2 | Headcount |
| Achieve 85% quota attainment across team | Percentage | |
| Reduce ramp time from 6 to 4 months | Time |
Product OKRs#
| Objective | Key Results | Metric Type |
|---|---|---|
| Deliver exceptional user experience | Increase NPS from 45 to 60 | Score |
| Reduce customer support tickets by 30% | Reduction | |
| Achieve 40% feature adoption within 30 days | Percentage | |
| Accelerate product velocity | Ship 12 major features this quarter | Count |
| Reduce bug backlog from 200 to 50 | Reduction | |
| Achieve 95% sprint completion rate | Percentage |
Marketing OKRs#
| Objective | Key Results | Metric Type |
|---|---|---|
| Become the thought leader in our space | Publish 24 blog posts with 10K+ views | Count |
| Grow organic traffic from 50K to 100K/month | Growth | |
| Achieve 5 media mentions in tier-1 publications | Count | |
| Generate pipeline efficiently | Deliver 500 MQLs at under $200 CAC | Efficiency |
| Achieve 30% MQL-to-SQL conversion | Percentage | |
| Generate $2M in marketing-sourced pipeline | Revenue |
Operations OKRs#
| Objective | Key Results | Metric Type |
|---|---|---|
| Achieve operational excellence | Maintain 99.9% system uptime | Percentage |
| Reduce incident response time to under 15 minutes | Time | |
| Complete SOC 2 Type II certification | Milestone | |
| Scale infrastructure efficiently | Reduce cloud costs by 25% | Reduction |
| Automate 80% of deployment pipeline | Percentage | |
| Achieve zero critical security vulnerabilities | Count |
Teamflect's OKR examples database provides additional department-specific examples categorized by business stage and function.
Common Mistakes in OKR Presentations#
These errors undermine OKR effectiveness and waste meeting time.
Mistake 1: Too Many OKRs on One Slide#
Problem: Cramming 8 objectives with 4 key results each onto a single slide.
Why it fails: Cognitive overload prevents comprehension. Synergita research recommends only 2-4 objectives with about 3 key results each at any level of the organization.
Fix: Use multiple slides. One overview slide with all objectives, then separate deep-dive slides for each objective.
Mistake 2: Outputs Instead of Outcomes#
Problem: Key results that measure activities rather than impact.
| Weak Key Result | Strong Key Result |
|---|---|
| "Launch email campaign" | "Generate 500 MQLs from email" |
| "Conduct 10 customer interviews" | "Validate 3 new feature hypotheses" |
| "Complete training program" | "Achieve 90% certification rate" |
Why it fails: Activities can be completed without achieving the objective. Outcomes prove impact.
Fix: Ask "So what?" for each key result. If completing it doesn't necessarily move the objective forward, reframe it.
Mistake 3: Missing Baseline Data#
Problem: Showing targets without starting points.
Why it fails: "Achieve NPS of 60" means nothing without knowing you started at 35 versus 55.
Fix: Always show the formula: Baseline to Target with current actual.
NPS: 35 (start) --> 48 (actual) --> 60 (target)
Mistake 4: No Owner Accountability#
Problem: OKRs presented without clear ownership.
Why it fails: Research shows teams where each objective and key result has one clear owner perform about 26% better. Shared ownership leads to confusion.
Fix: Name one owner per objective. That person isn't doing all the work--they're responsible for ensuring progress happens.
Mistake 5: Status Without Context#
Problem: Green/yellow/red status without explaining trajectory.
Why it fails: A key result at 60% completion on day 45 of 90 is on track. The same 60% on day 80 is off track. Status requires time context.
Fix: Show trajectory, not just snapshot. Include "days remaining" or "expected completion" alongside current status.
Mistake 6: Treating OKRs as Tasks#
Problem: Key results that are binary checkboxes rather than measurable spectrums.
| Task (Weak) | Measurable (Strong) |
|---|---|
| "Hire a VP of Sales" | "VP Sales closes first deal within 90 days of start" |
| "Launch mobile app" | "Mobile app achieves 10K downloads in first month" |
| "Complete rebrand" | "Brand awareness increases from 15% to 25%" |
Why it fails: Binary outcomes don't allow partial credit or course correction mid-quarter.
Fix: Express outcomes on a continuum that can be measured incrementally.
Tips for Quarterly OKR Reviews#
Quarterly reviews are where OKRs prove their value--or reveal dysfunction. These practices make reviews productive.
Before the Meeting#
Prepare the data. Update all actuals 24-48 hours before the review. Nothing undermines credibility faster than presenting last week's numbers.
Pre-circulate the deck. Board Intelligence research shows executives retain more when they can preview materials. Send the OKR slides ahead with a one-paragraph summary.
Identify the conversation topics. Not every OKR needs discussion. Flag 2-3 that require decisions or alignment.
During the Meeting#
Lead with the headline. Start with "We hit 72% of our Q4 objectives, up from 65% in Q3" not "Let me walk you through each OKR."
Timebox by exception. Green items need 30 seconds each. Yellow items need 2 minutes. Red items need 5 minutes with root cause and recovery plan.
Separate retrospective from planning. Review last quarter first, completely. Then shift to next quarter's OKRs. Mixing creates confusion.
The Quarterly Review Agenda#
| Segment | Duration | Focus |
|---|---|---|
| Headlines | 5 min | Overall performance summary |
| Green OKRs | 10 min | Quick wins, what worked |
| Yellow OKRs | 15 min | Course corrections needed |
| Red OKRs | 20 min | Root cause, recovery plans |
| Key learnings | 10 min | What to carry forward |
| Next quarter preview | 15 min | Draft OKRs for discussion |
| Decisions & actions | 10 min | Clear next steps |
Scoring Conventions#
At quarter end, grade each key result and roll up to objectives:
| Score | Interpretation | Action |
|---|---|---|
| 0.0-0.3 | Failed to make real progress | Investigate root cause |
| 0.4-0.6 | Made progress but fell short | Identify barriers |
| 0.7-1.0 | Delivered strong results | Celebrate, share learnings |
| Above 1.0 | Exceeded target | May indicate sandbagging |
Google's OKR philosophy expects average scores of 0.6-0.7 on stretch goals. Consistently hitting 1.0 suggests targets aren't ambitious enough.
End-of-Cycle Retrospectives#
According to OKRs Tool research, teams that run structured OKR retrospectives complete 30-45% more objectives than those that skip them.
Retrospective questions to address:
- What helped us achieve our key results?
- What blocked progress?
- What should we continue, stop, or start?
- How should next quarter's OKRs differ?
Building OKR Templates in PowerPoint#
You have three options for creating OKR slides, each with different trade-offs.
Method 1: Native PowerPoint#
Build from scratch using tables, shapes, and SmartArt.
Time required: 45-60 minutes for a complete OKR deck
Pros:
- No additional tools needed
- Full design control
- Works on any computer
Cons:
- Manual updates for each review
- Progress bars require shape manipulation
- Time-consuming formatting
Best for: One-time presentations, custom branded templates
Method 2: Pre-Built Templates#
Download templates from SlideModel, SlideTeam, or similar providers.
Time required: 15-30 minutes to customize
Pros:
- Professional starting point
- Multiple layout options
- Charts and graphics included
Cons:
- May not match your brand
- Limited customization
- Ongoing license costs
SlideModel and SlidesCarnival offer popular OKR templates ranging from free to premium tiers.
Method 3: Chart Add-ins#
Use tools like Deckary for data-linked progress charts.
Time required: 10-15 minutes with Excel data
Pros:
- Charts update automatically from Excel
- Professional visualization quality
- Progress bars and gauges included
- Consistent formatting
Cons:
- Requires add-in installation
- Learning curve for first use
Best for: Recurring quarterly reviews, data-heavy OKR tracking, teams that maintain OKR data in spreadsheets
For teams tracking OKRs in Excel or Google Sheets, add-ins that link PowerPoint charts to source data eliminate manual updates. When actuals change, the OKR slides update automatically.
Template Comparison#
| Feature | Native PowerPoint | Pre-Built Templates | Chart Add-ins |
|---|---|---|---|
| Setup time | 45-60 min | 15-30 min | 10-15 min |
| Update time | 20-30 min | 15-20 min | 1-2 min |
| Data linking | Manual | Manual | Automatic |
| Progress bars | Manual shapes | Included | Automatic |
| Customization | Unlimited | Moderate | High |
| Cost | Free | $15-50/template | $49-119/year |
Integrating OKRs with Other Presentation Types#
OKRs rarely stand alone. They connect to broader strategic narratives.
OKRs and KPI Dashboards#
OKRs track ambitious goals; KPIs track ongoing performance. Most quarterly reviews include both.
Presentation structure:
- KPI Dashboard (how the business is performing)
- OKR Review (how we're progressing on priorities)
- Variance Analysis (why gaps exist)
- Action Plans (what we'll do about it)
See our KPI dashboard PowerPoint guide for designing the performance metrics portion.
OKRs and Roadmaps#
OKRs define what to achieve; roadmaps define how and when. Present them together for complete strategic clarity.
Connection points:
- Each roadmap phase should connect to specific OKRs
- Key results often correspond to roadmap milestones
- Progress on roadmap items drives OKR completion
Our roadmap slide guide covers visual timeline presentation.
OKRs and Executive Summaries#
For board presentations, the OKR overview feeds into the executive summary.
Integration approach:
- Executive summary references OKR status at high level
- OKR detail slides in body of deck
- Full OKR scorecard in appendix
See our executive summary slides guide for structuring the narrative.
Summary: Key Takeaways#
OKR presentations bridge strategy and execution. Done well, they create alignment and accountability. Done poorly, they waste time and obscure priorities.
Focus on fewer OKRs. Teams with 3-5 objectives outperform those tracking more. If it doesn't fit on one dashboard, you're trying to do too much.
Measure outcomes, not activities. Key results should prove the objective is achieved, not document work completed.
Design for scanning. Executives spend seconds, not minutes, on each slide. Traffic lights, progress bars, and clear hierarchy make status immediately visible.
Show trajectory, not just snapshots. A key result at 60% means different things depending on timeline. Always include time context.
Assign clear ownership. One owner per objective. Shared ownership creates confusion and reduces completion rates by 26%.
Run structured reviews. Weekly check-ins drive 43% higher goal completion. End-of-quarter retrospectives accelerate learning.
Connect OKRs to strategy. OKRs should cascade from company priorities to team execution. Misaligned OKRs waste organizational energy.
Update automatically when possible. For recurring quarterly reviews, chart add-ins like Deckary that link to Excel data eliminate manual formatting and ensure accuracy.
The goal isn't a beautiful OKR template. It's a presentation that drives focus, surfaces blockers, and enables decisions in the room. Master that, and you've mastered the art of goal-oriented leadership.
Build consulting slides in seconds
Describe what you need. AI generates structured, polished slides — charts and visuals included.
Try Free