Value Chain Analysis Template: PowerPoint Guide for Consultants
Value chain analysis template for PowerPoint with step-by-step instructions. Learn Porter's framework, see industry examples, and build consulting-grade slides.
Value chain analysis is a strategic framework that examines how a company creates value through its business activities. Developed by Michael Porter in 1985, it breaks down an organization into nine activity categories—five primary activities (inbound logistics, operations, outbound logistics, marketing and sales, service) and four support activities (infrastructure, HR, technology development, procurement)—to identify cost drivers and differentiation sources.
The framework reveals three things: where the company spends money, where it creates customer value, and where competitive advantages or disadvantages exist. These insights drive strategic decisions about where to invest, what to improve, and how to compete.
This guide covers Porter's original framework, templates for different industries, step-by-step slide creation, and the mistakes that reduce strategic analysis to activity listing.
What Is Value Chain Analysis?#
Value chain analysis is a strategic framework that examines how a company creates value through its business activities. Developed by Michael Porter in his 1985 book Competitive Advantage, it breaks down an organization into strategically relevant activities to understand cost behavior and identify differentiation sources.
The core premise: companies are more than financial statements. They're collections of activities—designing, producing, marketing, delivering, and supporting products. Each activity either adds value that customers will pay for or consumes resources without creating proportional value.
| Concept | Definition | Strategic Implication |
|---|---|---|
| Value | What customers are willing to pay | Drives pricing power and revenue |
| Activities | Discrete tasks that create value | Unit of competitive analysis |
| Margin | Value minus cost of activities | Measures competitive advantage |
| Linkages | Connections between activities | Source of optimization and differentiation |
Porter's insight was that competitive advantage doesn't come from the company as a whole—it comes from the specific activities a company performs and how they connect. Two companies in the same industry might have identical strategies but vastly different value chains.
Why Value Chain Analysis Matters#
Understanding your value chain reveals three things:
Cost drivers. Which activities consume the most resources? Where are economies of scale possible? What activities could be outsourced or eliminated?
Differentiation sources. Which activities create unique value for customers? Where do you outperform competitors? What activities justify premium pricing?
Strategic linkages. How do activities interact? Can improving one activity reduce costs or increase value in another? Are there optimization opportunities across the chain?
These insights drive strategic decisions about where to invest, what to improve, and how to compete.
Porter's Value Chain Framework Explained#
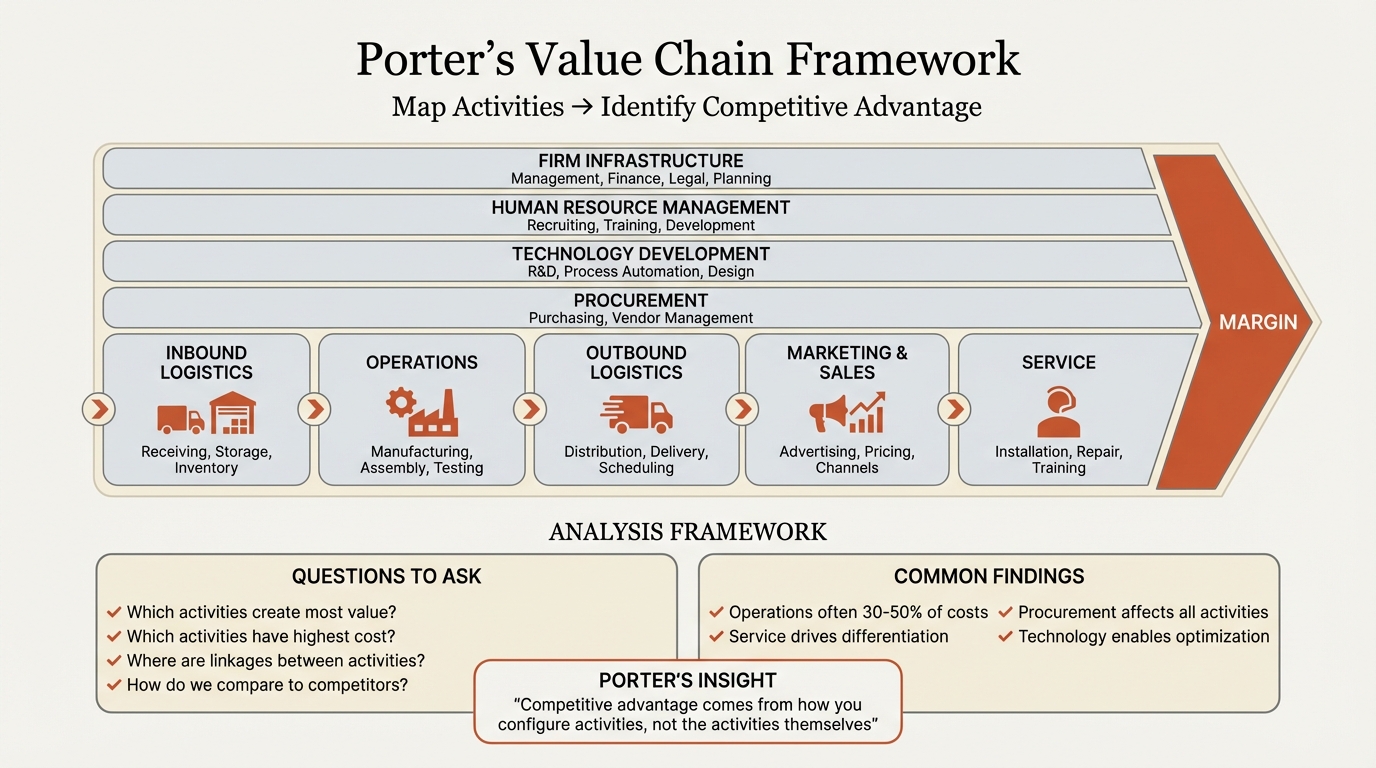
Porter's value chain model divides company activities into two categories: primary activities that directly create and deliver products, and support activities that enable primary activities to function.
The framework is typically visualized as a large arrow pointing right—representing value flow toward the customer—with primary activities forming the arrow's base and support activities stacked above.
The Visual Structure#
+--------------------------------------------------+
|           FIRM INFRASTRUCTURE                    |
+--------------------------------------------------+
|        HUMAN RESOURCE MANAGEMENT                 |
+--------------------------------------------------+
|          TECHNOLOGY DEVELOPMENT                  |
+--------------------------------------------------+
|              PROCUREMENT                         |
+--------------------------------------------------+
| INBOUND   | OPERATIONS | OUTBOUND | MARKETING | SERVICE |  MARGIN
| LOGISTICS |            | LOGISTICS| & SALES   |         |
+-----------+------------+----------+-----------+---------+
              PRIMARY ACTIVITIES
The arrow shape emphasizes that all activities contribute to margin—the difference between the value customers pay and the cost of performing activities. Wide margins indicate strong competitive position; thin margins suggest activities need optimization.
Primary Activities vs Support Activities#
Understanding the distinction between primary and support activities is fundamental to applying the framework correctly.
Primary Activities#
Primary activities directly involve creating, selling, and servicing a product. They follow the physical flow from raw materials to customer service.
| Activity | Description | Examples |
|---|---|---|
| Inbound Logistics | Receiving, storing, and distributing inputs | Warehouse management, inventory control, supplier scheduling, returns to suppliers |
| Operations | Transforming inputs into finished products | Manufacturing, packaging, assembly, equipment maintenance, testing, facility operations |
| Outbound Logistics | Collecting, storing, and distributing products to buyers | Finished goods warehousing, delivery vehicle operations, order processing, scheduling |
| Marketing & Sales | Inducing and enabling customers to purchase | Advertising, promotion, sales force, channel selection, pricing, quoting |
| Service | Maintaining and enhancing product value post-sale | Installation, repair, training, parts supply, product adjustment |
Each primary activity can be subdivided further depending on the industry and company. A manufacturer's operations might include dozens of sub-activities; a software company's operations might involve development, testing, and deployment.
Support Activities#
Support activities enable primary activities to occur. They span across all primary activities rather than linking to specific ones.
| Activity | Description | Examples |
|---|---|---|
| Firm Infrastructure | General management, planning, finance, legal, quality | Strategic planning, accounting, government affairs, quality management |
| Human Resource Management | Recruiting, training, development, compensation | Talent acquisition, training programs, performance management, labor relations |
| Technology Development | Improving products and processes | R&D, process automation, design, technology research |
| Procurement | Purchasing inputs for the value chain | Supplier selection, negotiation, purchasing systems, vendor management |
Note that procurement supports all activities, not just inbound logistics. Marketing needs to procure advertising services. Operations procures maintenance equipment. Technology development procures research tools.
The Margin#
The margin represents the difference between total value created (what customers pay) and the aggregate cost of performing value activities. A positive margin means the company creates more value than it consumes—the definition of a viable business.
Strategic analysis focuses on which activities contribute most to margin (through value creation or cost efficiency) and which activities threaten margin (through excessive cost or insufficient value creation).
When to Use Value Chain Analysis#
Value chain analysis is most valuable in specific strategic contexts. Knowing when to apply it—and when other frameworks fit better—improves analytical efficiency.
Ideal Use Cases#
Cost reduction initiatives. When a company needs to cut costs without sacrificing competitiveness, value chain analysis identifies which activities consume excessive resources and where efficiency improvements are possible.
Competitive benchmarking. Comparing your value chain to competitors reveals where you have advantages, where you're disadvantaged, and where investment should focus.
Vertical integration decisions. Should you perform an activity in-house or outsource it? Value chain analysis clarifies the strategic importance and cost structure of each activity.
M&A due diligence. Understanding a target's value chain reveals integration opportunities, operational synergies, and potential culture clashes.
Digital transformation planning. Which activities should be automated or digitized? Value chain analysis prioritizes transformation investments by strategic impact.
New market entry. Can your existing value chain support a new market, or do you need to build new capabilities? Analysis reveals gaps and requirements.
When Other Frameworks Fit Better#
| Situation | Better Framework | Why |
|---|---|---|
| Industry attractiveness | Porter's Five Forces | Value chain is internal; Five Forces is external |
| Quick strategic assessment | SWOT Analysis | SWOT is faster for broad overview |
| Competitor positioning | Competitive Analysis | Dedicated competitor comparison tools |
| Macro environment | PESTLE | Value chain doesn't address external trends |
Value chain analysis is company-focused and activity-focused. For industry-level or external analysis, combine it with other frameworks.
Step-by-Step: Creating Your Value Chain Slide#
Building a value chain analysis presentation requires both analytical rigor and visual clarity. Here's our process for creating slides that communicate effectively.
Step 1: Define Scope and Objectives#
Before touching PowerPoint, clarify what you're analyzing and why.
Scope questions:
- Which business unit or product line?
- Which geographic region?
- What time period?
Objective questions:
- Are we looking for cost reduction opportunities?
- Are we identifying differentiation sources?
- Are we benchmarking against competitors?
Document these decisions. They'll guide every subsequent choice.
Step 2: Map Activities to Categories#
List all significant activities your company performs, then assign each to the appropriate category.
| Primary Category | Your Company's Activities | Approximate Cost (%) |
|---|---|---|
| Inbound Logistics | ||
| Operations | ||
| Outbound Logistics | ||
| Marketing & Sales | ||
| Service | ||
| Support Category | ||
| Firm Infrastructure | ||
| Human Resources | ||
| Technology Development | ||
| Procurement |
Don't aim for exhaustive lists. Focus on activities that are strategically significant—either because they consume substantial resources or create meaningful differentiation.
Step 3: Analyze Each Activity#
For each significant activity, assess:
Cost structure:
- What does this activity cost (absolute and percentage of total)?
- What drives cost variability?
- How do our costs compare to competitors?
Value contribution:
- How does this activity create customer value?
- Is it a source of differentiation?
- Could customers tell if we stopped doing it?
Improvement potential:
- Can this activity be performed more efficiently?
- Can it be outsourced or automated?
- What investments would improve performance?
Step 4: Identify Linkages#
Activities don't exist in isolation. Look for connections where changes in one activity affect others.
Example linkages:
- Better supplier relationships (procurement) reduce quality issues (operations)
- Improved design (technology development) simplifies manufacturing (operations)
- Enhanced customer data (marketing) improves service targeting (service)
Linkages often represent the largest optimization opportunities because they're invisible when analyzing activities separately.
Step 5: Build the Visual#
Now create the PowerPoint slide. Follow these design principles:
Structure:
- Use the classic arrow shape pointing right
- Stack support activities horizontally above primary activities
- Include margin section on the right side
Colors:
- Consistent color palette across all activities
- Consider highlighting activities with findings (cost issues in red, advantages in green)
- Use your company's brand colors where appropriate
Icons:
- Add recognizable icons to each activity box for quick visual identification
- Keep icons simple and consistent in style
- Icon libraries provide consulting-ready options
Text:
- Activity labels should be brief (2-3 words)
- Add key data points (cost %, performance metrics) where space permits
- Save detailed analysis for supporting slides
Step 6: Create Supporting Detail Slides#
The overview diagram tells the story at a glance. Supporting slides provide evidence and recommendations.
Per-activity detail slides include:
- Current state description
- Key cost drivers or value sources
- Benchmarking data vs. competitors
- Specific improvement recommendations
- Investment requirements and expected impact
Synthesis slides include:
- Priority activities for improvement
- Cross-activity linkages and optimization opportunities
- Strategic implications and recommended actions
- Implementation roadmap
Step 7: Apply Consulting Formatting Standards#
Follow consulting slide standards for professional presentation:
- Action titles that state findings, not topics
- Consistent fonts (typically 10-14pt for body text)
- Aligned elements (use Deckary's alignment shortcuts)
- White space for readability
- Source citations for data
Continue reading: Bullet Charts in PowerPoint · Deloitte Presentation Template · Traction Slide
Build consulting slides in seconds
Describe what you need. AI generates structured, polished slides — charts and visuals included.
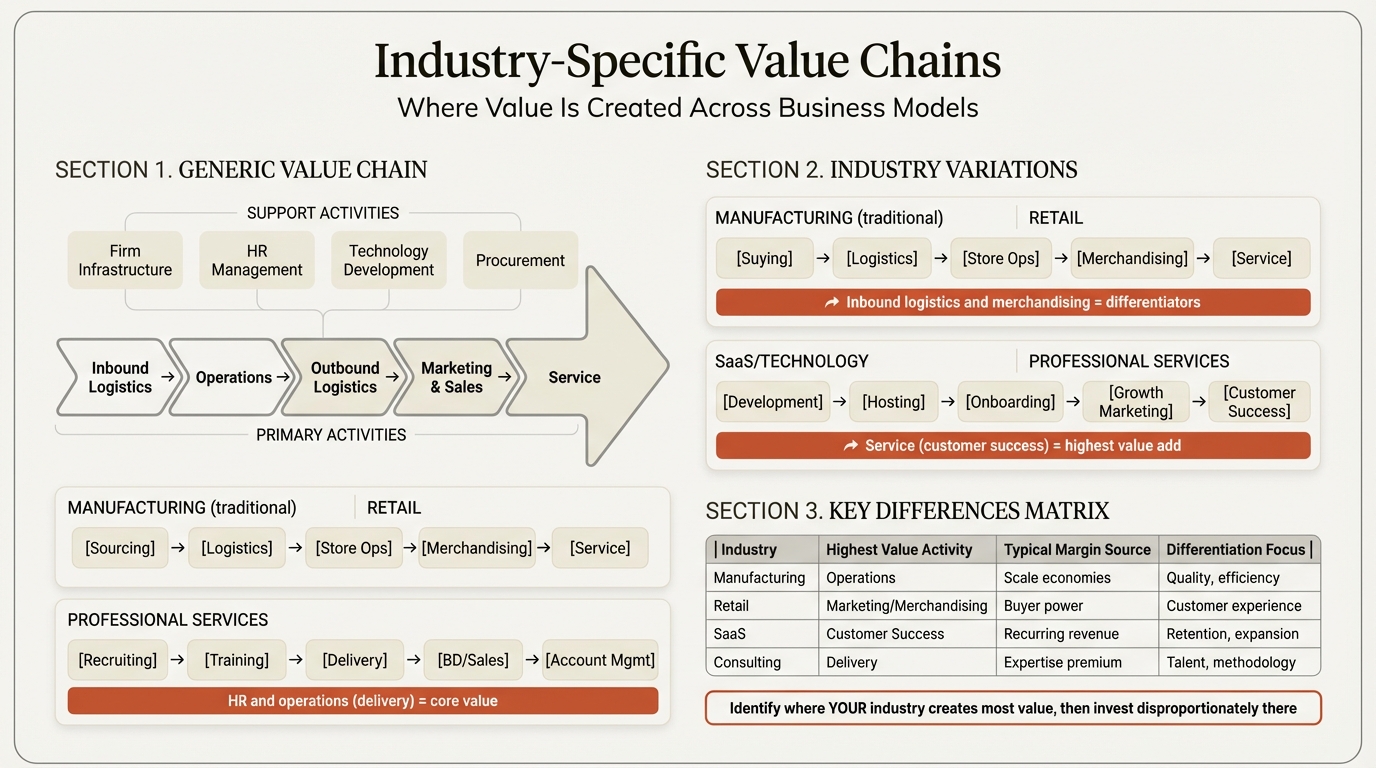
Value Chain Analysis Examples by Industry#
Value chain analysis looks different across industries. The same framework adapts to manufacturing, services, technology, and retail contexts.
Manufacturing Example: Consumer Electronics#
A consumer electronics manufacturer's value chain emphasizes operations and technology development.
| Activity | Key Sub-Activities | Strategic Focus |
|---|---|---|
| Inbound Logistics | Component sourcing from Asia; JIT inventory management | Supplier consolidation, inventory reduction |
| Operations | Automated assembly; quality testing; packaging | Automation investment, defect reduction |
| Outbound Logistics | Regional distribution centers; carrier partnerships | Shipping cost optimization, delivery speed |
| Marketing & Sales | Retail partnerships; e-commerce; brand advertising | Channel mix optimization, D2C growth |
| Service | Warranty support; repair centers; software updates | Service cost reduction, customer satisfaction |
| Technology Development | Product R&D; manufacturing process improvement | Innovation pipeline, patent portfolio |
Key insight: Competitive advantage in consumer electronics often comes from technology development (product innovation) and operations (manufacturing efficiency). Companies like Apple differentiate through design; companies like Samsung compete on manufacturing scale.
Retail Example: Fashion Apparel#
A fashion retailer's value chain emphasizes marketing and supply chain speed.
| Activity | Key Sub-Activities | Strategic Focus |
|---|---|---|
| Inbound Logistics | Fast fashion sourcing; trend forecasting; sample development | Speed to market, supplier agility |
| Operations | Quality inspection; repackaging; distribution center processing | Inventory accuracy, throughput |
| Outbound Logistics | Store replenishment; e-commerce fulfillment; returns processing | Omnichannel inventory, returns reduction |
| Marketing & Sales | Brand marketing; store experience; e-commerce conversion | Customer acquisition, channel integration |
| Service | Style advice; alterations; loyalty programs | Customer retention, lifetime value |
| Procurement | Fabric sourcing; manufacturer relationships | Cost negotiation, supplier diversification |
Key insight: Fast fashion competitors like Zara and H&M win through compressed inbound logistics and operations cycles—getting trends from runway to store in weeks rather than months.
Technology Example: SaaS Platform#
A SaaS company's value chain centers on technology development and service.
| Activity | Key Sub-Activities | Strategic Focus |
|---|---|---|
| Inbound Logistics | Cloud infrastructure procurement; third-party API integration | Vendor management, API reliability |
| Operations | Software development; testing; deployment; uptime management | Development velocity, system reliability |
| Outbound Logistics | Product delivery (minimal for SaaS); feature releases | Release management, documentation |
| Marketing & Sales | Content marketing; sales development; account executives; partnerships | CAC optimization, sales efficiency |
| Service | Customer success; technical support; onboarding; training | NRR improvement, churn reduction |
| Technology Development | Core product R&D; platform architecture; security | Product differentiation, technical moat |
Key insight: SaaS value chains shift emphasis from physical logistics to customer success and technology development. Service activities (customer success) directly drive revenue retention, making them strategically critical.
Professional Services Example: Management Consulting#
A consulting firm's value chain is talent-centric with minimal physical operations.
| Activity | Key Sub-Activities | Strategic Focus |
|---|---|---|
| Inbound Logistics | Knowledge management; research databases; methodology libraries | Knowledge accessibility, research quality |
| Operations | Engagement delivery; analysis; client workshops; report writing | Utilization, quality, methodology consistency |
| Outbound Logistics | Report delivery; implementation handoff | Documentation quality, knowledge transfer |
| Marketing & Sales | Thought leadership; relationship development; proposal writing | Brand positioning, win rates |
| Service | Post-engagement support; alumni relationships | Repeat business, referrals |
| Human Resources | Recruiting; training; performance management; retention | Talent quality, leverage model |
Key insight: Consulting firm value chains are dominated by human resources and operations. Competitive advantage comes from talent (HR) and methodology (operations)—the ability to consistently deliver high-quality work.
Best Practices for Value Chain Presentations#
After building dozens of value chain analyses, we've identified practices that separate effective presentations from academic exercises.
Connect Every Slide to Strategic Action#
Value chain analysis isn't complete until it drives decisions. Every activity analysis should answer: "So what should we do?"
Weak finding: "Operations represents 45% of our cost structure."
Strong finding: "Operations costs are 12% higher than industry benchmark, driven by manual quality inspection. Automating inspection would reduce costs by $8M annually with 18-month payback."
Quantify Wherever Possible#
Numbers make analysis defensible and actionable.
| Qualitative Observation | Quantified Alternative |
|---|---|
| "Our logistics are inefficient" | "Logistics costs are 8% of revenue vs. industry average of 5%" |
| "Marketing is a strength" | "Customer acquisition cost is $45 vs. competitor average of $72" |
| "Service needs improvement" | "NPS score of 32 trails category leader at 58" |
Use financial data, operational metrics, benchmarks, and customer feedback to ground observations in evidence.
Compare to Competitors#
Value chain analysis gains power through comparison. A 45% operations cost isn't high or low until you compare it to competitors and industry benchmarks.
Build comparison matrices for key activities:
| Activity | Our Company | Competitor A | Competitor B | Industry Avg |
|---|---|---|---|---|
| Inbound Logistics (% of revenue) | 3.2% | 2.8% | 4.1% | 3.5% |
| Operations (% of revenue) | 28.4% | 24.2% | 31.8% | 27.0% |
| Outbound Logistics (% of revenue) | 6.8% | 5.9% | 7.2% | 6.5% |
| Marketing & Sales (% of revenue) | 22.1% | 28.6% | 18.4% | 23.0% |
| Service (% of revenue) | 4.5% | 3.8% | 5.1% | 4.2% |
This comparison immediately highlights where you're advantaged (lower than average) and disadvantaged (higher than average).
Highlight Linkages and Trade-offs#
Activities interact. Show connections that create optimization opportunities.
Example linkage analysis:
"Increasing technology development investment by $2M would enable automated operations, reducing operations costs by $5M and quality failures by 40%. The cross-activity impact creates 2.5x return on investment."
Use Consistent Visual Language#
Establish conventions and apply them throughout the presentation:
- Color code by finding type (red = problem, green = advantage, yellow = opportunity)
- Consistent icon style for all activities
- Standard table and chart formats
- Uniform slide structure
Tools like Deckary help maintain visual consistency with alignment features and icon libraries that match consulting aesthetics.
Common Mistakes to Avoid#
We've seen value chain analyses fail in predictable ways. Avoid these pitfalls.
Mistake 1: Generic Activity Descriptions#
Using Porter's categories without tailoring them to your industry renders the analysis useless.
Generic (unhelpful): "Operations: Manufacturing and assembly"
Industry-specific (useful): "Operations: Precision CNC machining for aerospace components, requiring ISO 9001/AS9100 certification, proprietary tooling, and real-time quality monitoring. 23 unique operations across 3 facilities."
The more specific your activity descriptions, the more actionable your findings.
Mistake 2: Ignoring Support Activities#
Many analyses focus on primary activities and treat support activities as afterthoughts. This misses critical strategic elements.
Support activities often drive differentiation:
- Technology development creates product advantages
- Human resources determines service quality
- Procurement affects cost position
- Infrastructure (systems, processes) enables scale
Give support activities equal analytical attention.
Mistake 3: Analyzing Activities in Isolation#
Value chain analysis loses power when activities are examined independently. The framework's strength is revealing connections.
Questions to uncover linkages:
- How does this activity affect others?
- What activities does this one depend on?
- Where would investment here have cascading benefits?
- What trade-offs exist between activities?
Mistake 4: Focusing Only on Cost#
Cost optimization is valuable, but not the only insight available. Value chain analysis also reveals differentiation opportunities.
Cost focus: "How can we reduce operations expense?"
Differentiation focus: "Which operations capabilities justify premium pricing? How can we strengthen them?"
The best analyses balance both perspectives.
Mistake 5: Static Analysis#
Value chains evolve. A point-in-time analysis misses trends and strategic direction.
Include:
- Historical changes in activity importance
- Emerging technologies affecting activities
- Competitor moves changing competitive dynamics
- Planned investments and their expected impact
Mistake 6: No Action Implications#
The most common failure: analysis without recommendations.
Every value chain presentation should end with:
- Priority activities for improvement
- Specific actions recommended
- Investment requirements
- Expected impact and timeline
If your analysis doesn't drive decisions, it's a wasted exercise.
Combining Value Chain with Other Frameworks#
Value chain analysis works best alongside complementary strategic tools. Here's how to integrate frameworks effectively.
Value Chain + Porter's Five Forces#
Five Forces tells you if the industry is attractive. Value chain tells you how to compete within it.
| Framework | Question Answered | When to Use |
|---|---|---|
| Five Forces | Should we compete here? | Market entry, industry assessment |
| Value Chain | How should we compete? | Operational strategy, competitive advantage |
A complete strategy engagement often uses both: Five Forces for industry analysis, then value chain for company-specific recommendations.
For a detailed guide on industry analysis, see our Porter's Five Forces template.
Value Chain + SWOT Analysis#
SWOT categorizes findings; value chain provides structure for finding them.
- Value chain analysis feeds SWOT by identifying specific strengths (low-cost operations) and weaknesses (poor customer service)
- SWOT synthesizes value chain findings into actionable quadrants
- Together they move from detailed analysis to strategic overview
Our SWOT analysis guide covers the synthesis framework.
Value Chain + Competitive Analysis#
Comparing your value chain to competitors' reveals competitive gaps and advantages.
| Your Activity | Your Performance | Competitor Performance | Gap | Action |
|---|---|---|---|---|
| Operations | 28% of revenue | 24% of revenue | -4% | Automation investment |
| Marketing | $45 CAC | $72 CAC | +37% | Strength—maintain approach |
| Service | 32 NPS | 58 NPS | -26 | Training + process redesign |
See our competitive analysis template for benchmarking frameworks.
Value Chain + MECE Problem Solving#
The MECE framework ensures value chain analysis is rigorous:
- Mutually Exclusive: Each activity belongs to one category
- Collectively Exhaustive: All significant activities are captured
Apply MECE thinking to both activity categorization and sub-activity breakdown.
Summary#
Value chain analysis remains one of the most practical frameworks for understanding competitive advantage four decades after Porter introduced it. Used correctly, it reveals where companies create value, where they destroy it, and what to do about it.
Key principles:
- Nine activities create value: Five primary (inbound logistics, operations, outbound logistics, marketing and sales, service) and four support (infrastructure, HR, technology, procurement)
- Competitive advantage comes from activities, not companies: Analyze at the activity level to find real insights
- Linkages matter as much as activities: Cross-activity connections often hold the largest optimization opportunities
- Analysis must drive action: Every finding should connect to strategic recommendations
- Combine with other frameworks: Value chain works best alongside Five Forces, SWOT, and competitive analysis
For consulting presentations:
- Tailor activities to your specific industry—avoid generic descriptions
- Quantify findings with cost data, benchmarks, and metrics
- Compare to competitors to establish relative position
- Highlight linkages between activities
- End with prioritized recommendations and investment requirements
The framework is simple. The value comes from rigorous application and insight generation. A well-executed value chain analysis exposes the operational reality behind financial performance—and points clearly to what should change.
That's what separates an activity diagram from strategic analysis.
Build consulting slides in seconds
Describe what you need. AI generates structured, polished slides — charts and visuals included.
Try Free