Porter's Five Forces Template: Industry Analysis Guide
Download our Porter's five forces template and learn how top consultants conduct competitive analysis. Step-by-step framework with scoring system and real examples.
Porter's Five Forces is a framework for analyzing the competitive structure of an industry, developed by Harvard professor Michael Porter in 1979. It identifies five forces that determine industry profitability: threat of new entrants, bargaining power of suppliers, bargaining power of buyers, threat of substitutes, and competitive rivalry.
Porter's insight was that industry structure, not just company capabilities, drives profitability. A mediocre company in a favorable industry often outperforms an excellent company in a brutal industry. Understanding these forces tells you whether an industry is worth entering and how to position within it.
This guide covers how to analyze each force, the scoring framework consultants use to rate industry attractiveness, common mistakes that weaken the analysis, and how to present Five Forces in PowerPoint that drives strategic decisions. This framework comes from applying Five Forces analysis across 40+ market entry engagements, tracking which factors actually predicted competitive dynamics versus which were noise.
What Is Porter's Five Forces?#
The framework examines where value leaks from an industry. Each force represents a different way that profits get competed away, bargained away, or disrupted entirely. When consultants rate forces as "high," they're identifying structural threats to margins—not just competitive intensity, but the fundamental economics of the industry.
The five forces break down into two categories:
Horizontal competition (fighting for customers):
- Threat of New Entrants — How easily can new competitors enter?
- Threat of Substitutes — Can customers switch to alternatives?
- Industry Rivalry — How intense is competition among existing players?
Vertical pressure (value chain dynamics): 4. Bargaining Power of Suppliers — How much leverage do suppliers have? 5. Bargaining Power of Buyers — How much leverage do customers have?
| Force | Key Question | High = Bad For |
|---|---|---|
| New Entrants | How easy is market entry? | Existing players |
| Supplier Power | Can suppliers dictate terms? | Buyers (your client) |
| Buyer Power | Can customers dictate terms? | Sellers (your client) |
| Substitutes | Are alternatives available? | Existing products |
| Rivalry | How fierce is competition? | All industry players |
The collective strength of these forces determines how much profit potential exists in an industry. If all five forces are intense—like in the airline industry—almost no company earns attractive returns. If forces are mild—like in soft drinks—there's room for healthy margins.
The Five Forces Explained#
Before diving into each force, understand the underlying logic: every force represents a threat to your ability to capture value. Strong forces mean value leaks to suppliers, buyers, substitutes, new entrants, or gets competed away by rivals.
The framework examines three "horizontal" competitive forces—rivalry, new entrants, and substitutes—and two "vertical" forces—supplier power and buyer power.
| Force Type | Forces Included | What It Analyzes |
|---|---|---|
| Horizontal | Rivalry, New Entrants, Substitutes | Competition for customers |
| Vertical | Supplier Power, Buyer Power | Value chain dynamics |
Let's examine each force in detail.
Threat of New Entrants#
New entrants bring fresh capacity and a desire to gain market share. They put pressure on prices, costs, and investment rates necessary to compete.
What Determines Entry Threat?#
The threat of new entrants depends on barriers to entry and expected retaliation from incumbents.
| Barrier Type | Low Threat (High Barrier) | High Threat (Low Barrier) |
|---|---|---|
| Capital Requirements | Heavy upfront investment needed | Minimal startup costs |
| Economies of Scale | Large scale needed for competitive costs | Small players can compete profitably |
| Brand Identity | Strong customer loyalty to incumbents | Customers easily switch to new brands |
| Switching Costs | High cost for customers to change | Easy for customers to try new options |
| Distribution Access | Channels locked up by incumbents | Multiple distribution options available |
| Regulatory/Legal | Licenses, patents protect incumbents | Few regulatory barriers |
| Expected Retaliation | Incumbents known to fight hard | Passive competitive response |
Industry Examples#
Airlines — Low to Medium Threat
Despite appearing unattractive, new entrants do emerge. Low-cost carriers like Southwest, Ryanair, and EasyJet successfully entered by introducing innovative cost-cutting models. However, massive capital requirements for aircraft, airport slots, and regulatory licenses keep the barrier meaningful.
Software/SaaS — High Threat
Cloud infrastructure reduced capital requirements dramatically. A startup can launch a competing product with minimal investment. The main barriers are network effects and switching costs—which vary by category.
Consulting Application#
When assessing new entrant threat, ask:
- What would it cost to enter this industry?
- How long to reach competitive scale?
- What would incumbents do in response?
- Have any recent entrants succeeded or failed?
Bargaining Power of Suppliers#
Suppliers capture value by charging higher prices, limiting quality, or shifting costs to industry participants. Powerful suppliers squeeze industry profitability.
What Drives Supplier Power?#
| Factor | High Supplier Power | Low Supplier Power |
|---|---|---|
| Concentration | Few suppliers dominate | Many suppliers compete |
| Switching Costs | Expensive to change suppliers | Easy to switch |
| Differentiation | Unique inputs with no substitutes | Commodity inputs |
| Forward Integration | Suppliers could become competitors | Unlikely to integrate forward |
| Industry Importance | Your industry is small customer | You're a major customer |
Industry Examples#
Airlines — Very High Supplier Power
Airlines depend on two critical inputs: aircraft and fuel. Only Boeing and Airbus supply commercial aircraft—a duopoly with substantial pricing power. Fuel prices are set by global commodity markets beyond airline control.
Retail — Low Supplier Power
Major retailers like Walmart have thousands of suppliers competing for shelf space. Walmart's purchasing volume gives it leverage to demand favorable terms. Suppliers need Walmart more than Walmart needs any single supplier.
Consulting Application#
Map your client's supplier landscape:
- Who are the top 5 suppliers by spend?
- What's the concentration ratio?
- Could suppliers integrate forward?
- Are there alternative sources?
Bargaining Power of Buyers#
Buyers capture value by forcing prices down, demanding better quality or service, and playing competitors against each other.
What Drives Buyer Power?#
| Factor | High Buyer Power | Low Buyer Power |
|---|---|---|
| Concentration | Few buyers purchase most volume | Fragmented customer base |
| Switching Costs | Easy to change suppliers | High costs to switch |
| Price Sensitivity | Highly price-conscious | Value-focused, less price sensitive |
| Product Differentiation | Products are commoditized | Unique, differentiated offerings |
| Backward Integration | Buyers could make it themselves | Unlikely to integrate backward |
| Information | Full price/cost transparency | Information asymmetry |
Industry Examples#
Airlines — High Buyer Power
Customers compare prices instantly through Skyscanner, Expedia, and Google Flights. Zero switching costs—passengers fly different carriers for each trip based purely on price. Business travelers have slightly lower price sensitivity but still compare options.
Enterprise Software — Low Buyer Power
Once a company implements an ERP system like SAP, switching costs are enormous. Years of data, customizations, trained employees, and integrated processes create lock-in. Vendors maintain pricing power with existing customers.
Consulting Application#
Segment buyers by power level:
- Who are the largest customers?
- What's customer concentration?
- How easily can they switch?
- What information do they have?
Threat of Substitutes#
Substitutes perform the same function as an industry's product through different means. They limit profit potential by placing a ceiling on prices.
What Determines Substitute Threat?#
| Factor | High Substitute Threat | Low Substitute Threat |
|---|---|---|
| Relative Price | Substitutes offer better value | Substitutes are more expensive |
| Switching Costs | Easy to switch to alternative | High friction to change |
| Buyer Propensity | Customers open to alternatives | Strong preference for current solution |
| Performance | Substitutes offer comparable quality | Substitutes underperform |
Industry Examples#
Airlines — Medium to High Threat
For short-haul routes: trains, buses, and cars substitute for flights. High-speed rail in Europe and Asia directly competes. Video conferencing substitutes for business travel—accelerated dramatically by remote work trends.
Smartphone Industry — Low Threat
What substitutes for a smartphone? Laptops handle some functions, but nothing replaces the combination of communication, computing, and portability in your pocket. The lack of substitutes supports Apple's pricing power.
Consulting Application#
Think broadly about substitutes:
- What job does the product do for customers?
- What else could accomplish that job?
- How do substitute economics compare?
- What trends affect substitute attractiveness?
Industry Rivalry#
Rivalry among existing competitors takes familiar forms: price discounting, new product introductions, advertising campaigns, and service improvements. High rivalry limits profitability.
What Drives Rivalry Intensity?#
| Factor | High Rivalry | Low Rivalry |
|---|---|---|
| Number of Competitors | Many similarly sized players | Few dominant players |
| Industry Growth | Slow growth, fight for share | Fast growth, room for all |
| Fixed Costs | High fixed costs drive volume pressure | Variable cost structure |
| Product Differentiation | Commoditized products | Differentiated offerings |
| Exit Barriers | High exit barriers trap capacity | Easy to exit, capacity leaves |
| Strategic Stakes | High strategic importance | Pure financial investment |
Industry Examples#
Airlines — Very High Rivalry
Multiple carriers compete on overlapping routes. High fixed costs (aircraft, gates) create pressure to fill seats at any price. Products are largely undifferentiated—a seat from A to B is similar across carriers. Exit barriers are high due to specialized assets and labor agreements.
Soft Drinks — Moderate Rivalry
Coca-Cola and Pepsi dominate with strong brands. Products are differentiated through brand identity. Neither company competes primarily on price. The duopoly structure limits destructive rivalry—both players understand that price wars hurt everyone.
Consulting Application#
Assess rivalry dynamics:
- How many competitors? What's concentration?
- What's industry growth rate?
- How differentiated are products?
- What's the competitive history?
Continue reading: Bullet Charts in PowerPoint · Deloitte Presentation Template · Traction Slide
Build consulting slides in seconds
Describe what you need. AI generates structured, polished slides — charts and visuals included.
When to Use Five Forces Analysis#
Five Forces is most valuable in specific strategic situations:
| Situation | How Five Forces Helps |
|---|---|
| Market Entry | Assess industry attractiveness before entering |
| M&A Due Diligence | Evaluate target's industry structure |
| Strategy Development | Identify forces to shape or exploit |
| Investment Analysis | Understand profit potential drivers |
| Competitive Response | Anticipate competitor and stakeholder moves |
When NOT to Use Five Forces#
The framework has limitations:
- Company-level analysis: Five Forces examines industries, not individual companies
- Rapid change: Static framework struggles with fast-moving industries
- Isolated use: Should be combined with other frameworks like PESTEL or MECE structures
- Too broad or narrow scope: Define the industry level correctly—not sector (too broad) or product (too narrow)
Porter himself emphasizes using Five Forces at the "line-of-business industry level"—the level where products compete directly.
How to Conduct Five Forces Analysis#
Here's our step-by-step process for Five Forces analysis:
Step 1: Define the Industry#
Be precise about scope. "Technology" is too broad. "Enterprise CRM software for mid-market companies" is appropriately specific.
| Too Broad | Appropriate | Too Narrow |
|---|---|---|
| Retail | Grocery retail | Organic produce at Whole Foods |
| Technology | Cloud infrastructure | AWS S3 storage specifically |
| Healthcare | Pharmaceutical manufacturing | Oncology drugs in Brazil |
Step 2: Identify the Players#
Map each force's participants:
- New Entrants: Who's positioned to enter? Who's tried recently?
- Suppliers: Who provides critical inputs? How concentrated?
- Buyers: Who are customers? How concentrated? How price-sensitive?
- Substitutes: What alternatives exist? How do economics compare?
- Rivals: Who competes directly? What's market share distribution?
Step 3: Gather Evidence#
For each force, collect data on relevant factors. Use:
- Industry reports and analyst research
- Company filings and investor presentations
- Expert interviews
- Trade publications
- Customer and supplier interviews
Step 4: Rate Each Force#
Using your evidence, rate each force as High, Medium, or Low. We use a structured scoring approach (detailed in the next section).
Step 5: Synthesize Implications#
The analysis isn't complete until you answer: "So what?"
- What does industry structure mean for profitability?
- Which forces most threaten your client?
- What can be done to improve position?
- How might forces evolve?
Step 6: Present Findings#
Structure your presentation with:
- Industry definition and context
- Five Forces diagram with ratings
- Deep-dive on each force with evidence
- Synthesis and strategic implications
- Recommendations
Rating and Scoring Forces#
We use a structured scoring framework to ensure consistent, defensible ratings.
Force Rating Framework#
For each force, assess multiple indicators and weight based on importance:
| Force | Key Indicators | Weight |
|---|---|---|
| New Entrants | ||
| Capital requirements | 25% | |
| Economies of scale | 20% | |
| Brand/loyalty barriers | 20% | |
| Regulatory barriers | 15% | |
| Access to distribution | 10% | |
| Expected retaliation | 10% | |
| Supplier Power | ||
| Supplier concentration | 30% | |
| Switching costs | 25% | |
| Input differentiation | 20% | |
| Forward integration threat | 15% | |
| Importance of volume | 10% | |
| Buyer Power | ||
| Buyer concentration | 25% | |
| Switching costs | 25% | |
| Price sensitivity | 20% | |
| Product differentiation | 15% | |
| Backward integration threat | 15% | |
| Substitutes | ||
| Relative price-performance | 35% | |
| Switching costs | 25% | |
| Buyer propensity | 25% | |
| Substitute availability | 15% | |
| Rivalry | ||
| Number of competitors | 20% | |
| Industry growth | 20% | |
| Fixed cost structure | 20% | |
| Product differentiation | 20% | |
| Exit barriers | 10% | |
| Strategic stakes | 10% |
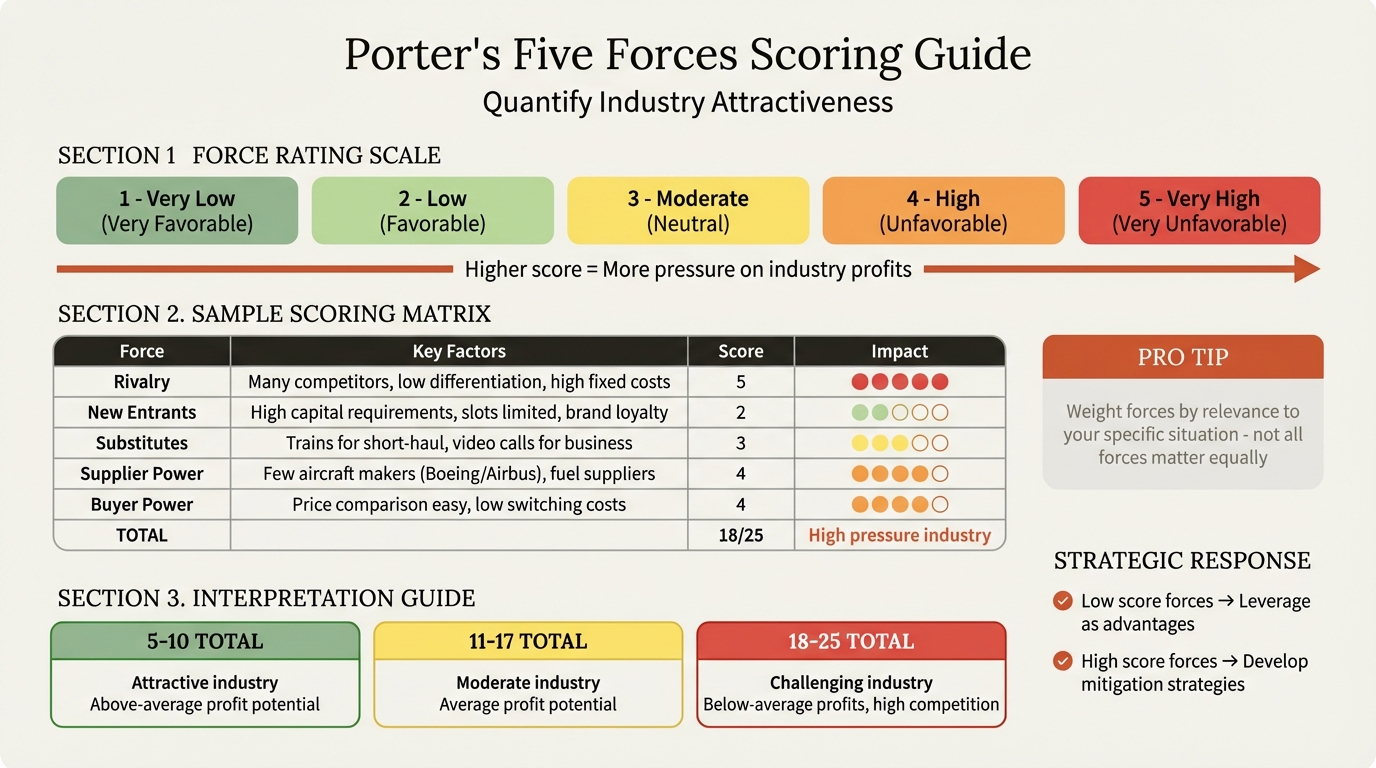
Scoring Scale#
Rate each indicator on a 1-5 scale:
| Score | Rating | Meaning |
|---|---|---|
| 1 | Very Low | Minimal threat/power |
| 2 | Low | Below average threat/power |
| 3 | Medium | Average threat/power |
| 4 | High | Above average threat/power |
| 5 | Very High | Severe threat/power |
Calculate Force Scores#
Multiply each indicator score by its weight, sum for total force score:
- 1.0-2.0 = Low force (favorable)
- 2.1-3.5 = Medium force (moderate)
- 3.6-5.0 = High force (unfavorable)
Example Scoring: Airline Industry#
| Indicator | Score | Weight | Weighted |
|---|---|---|---|
| Supplier Power | |||
| Supplier concentration | 5 | 30% | 1.50 |
| Switching costs | 4 | 25% | 1.00 |
| Input differentiation | 4 | 20% | 0.80 |
| Forward integration | 2 | 15% | 0.30 |
| Volume importance | 3 | 10% | 0.30 |
| Total | 3.90 (High) |
This structured approach ensures your ratings are evidence-based and defensible in partner reviews.
Five Forces Best Practices#
1. Be Industry-Specific#
Generic analysis adds no value. Every statement should be backed by industry-specific evidence.
Weak: "Buyer power is high because customers can switch."
Strong: "Buyer power is high—price comparison sites like Skyscanner enable instant comparison across 500+ carriers, and our survey data shows 67% of leisure travelers prioritize price above all other factors."
2. Quantify Where Possible#
Numbers strengthen analysis and make ratings defensible.
| Qualitative | Quantitative |
|---|---|
| "Many competitors" | "Top 5 players hold 85% market share" |
| "Low switching costs" | "Average customer acquisition cost is $50; churn rate is 15% annually" |
| "High capital requirements" | "$500M minimum investment for competitive scale" |
3. Consider Force Interactions#
Forces don't operate independently. Supplier power affects rivalry (shared cost pressures). New entrant threat depends on buyer loyalty (which affects buyer power).
4. Look Forward, Not Just Backward#
Current structure matters, but trends matter more. How are forces evolving?
- Technology changes reducing entry barriers?
- Consolidation increasing supplier power?
- New substitutes emerging?
5. Connect to Strategy#
The analysis should inform action. End every Five Forces presentation with "implications" and "recommendations."
Common Five Forces Mistakes#
Mistake 1: Confusing Industry and Company Analysis#
Five Forces analyzes industries, not companies. "Apple has strong brand loyalty" is a company observation. "Consumer electronics buyers have low switching costs" is an industry observation.
Mistake 2: Listing Without Analyzing#
We've seen countless Five Forces slides that list factors without assessing their impact or rating their strength. Every factor needs: evidence, rating, and implication.
Mistake 3: Static Snapshot#
Presenting current state without discussing how forces are changing misses half the value. Always include trend arrows.
Mistake 4: Wrong Industry Definition#
Too broad (all retail) misses segment differences. Too narrow (one product line) lacks strategic relevance. Define at the competitive market level.
Mistake 5: Ignoring Complementors#
Porter's original framework has been extended to include "complementors"—products that enhance your offering's value. For PC makers, software is a complement. Consider whether complementor dynamics matter for your industry.
Mistake 6: Superficial Evidence#
"Barriers to entry are high" isn't analysis. Specify which barriers, how high, and what evidence supports the claim.
Creating Five Forces in PowerPoint#
Slide Structure#
A complete Five Forces presentation typically includes:
- Title slide — Industry and analysis scope
- Overview slide — Five Forces diagram with summary ratings
- Force deep-dives — One slide per force with evidence
- Synthesis slide — What does this mean for profitability?
- Implications slide — Strategic recommendations
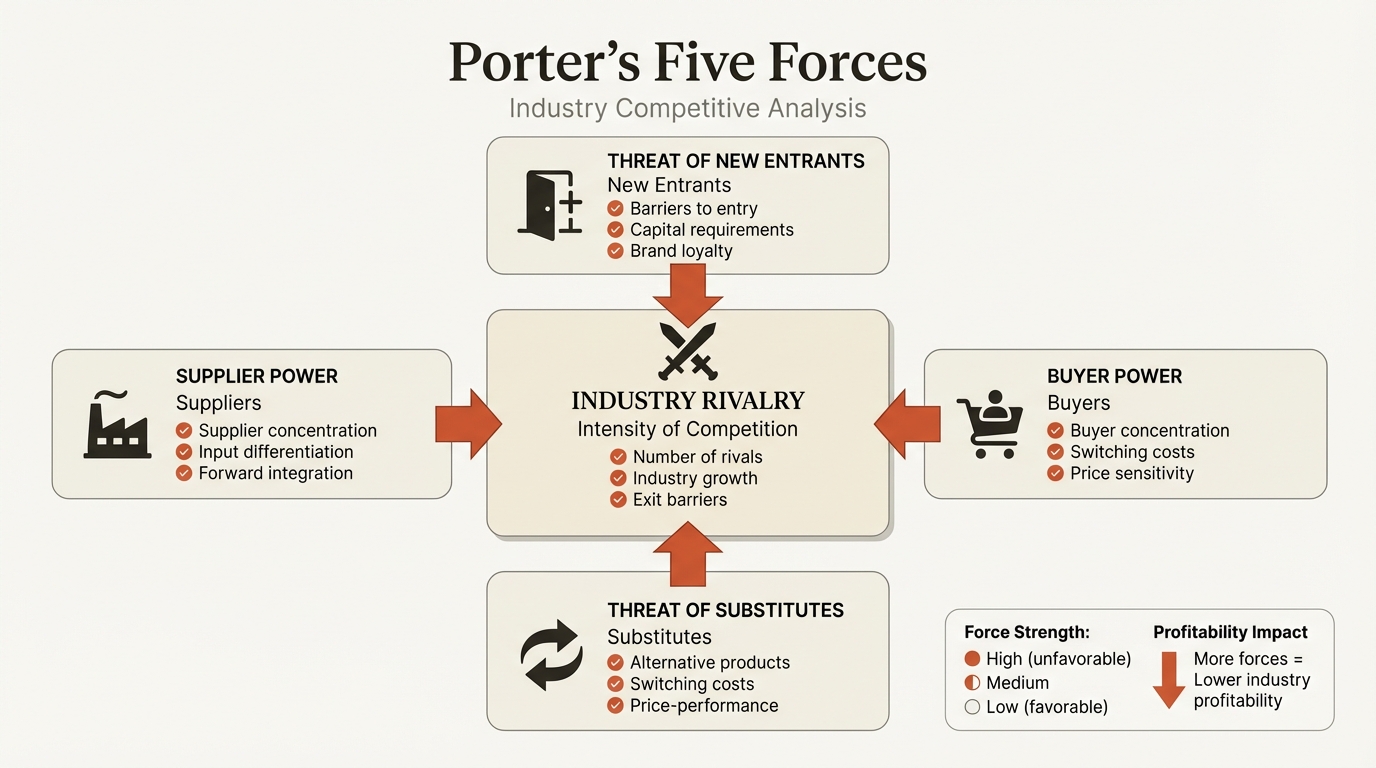
The Central Diagram#
The classic Five Forces diagram shows:
- Central box: Industry Rivalry
- Four surrounding boxes: Suppliers (left), Buyers (right), New Entrants (top), Substitutes (bottom)
- Arrows pointing inward showing pressure direction
Color-code by rating:
- Green = Low (favorable)
- Yellow = Medium (moderate)
- Red = High (unfavorable)
Formatting Standards#
Follow consulting slide standards:
- Clean, minimal design
- Consistent fonts and colors
- Clear visual hierarchy
- Evidence in supporting bullets
For diagram creation, tools like Deckary help build consistent strategic frameworks with proper alignment and formatting. The icon library includes business strategy icons useful for Five Forces diagrams.
Force Detail Slides#
Each force deserves a dedicated slide:
Structure:
- Force name and rating (H/M/L) in title
- Key indicators with evidence bullets
- Trend arrow showing direction
- Implications in action title
Example title: "Supplier Power is HIGH and increasing due to Boeing/Airbus duopoly"
Real-World Five Forces Examples#
Example 1: Airline Industry#
The airline industry demonstrates how powerful forces destroy profitability.
| Force | Rating | Key Evidence |
|---|---|---|
| New Entrants | Medium | $500M+ capital requirements, but low-cost carrier success shows entry is possible |
| Supplier Power | Very High | Boeing/Airbus duopoly; fuel prices beyond control |
| Buyer Power | High | Price comparison sites; zero switching costs; 67% price-first customers |
| Substitutes | Medium-High | High-speed rail; video conferencing; car travel for short routes |
| Rivalry | Very High | 10+ major carriers per region; undifferentiated product; high fixed costs |
Synthesis: Four of five forces are unfavorable. Industry profitability is structurally challenged. Success requires cost leadership (Southwest model) or differentiation (premium carriers).
Example 2: Enterprise Software (SaaS)#
Enterprise SaaS shows more favorable industry structure.
| Force | Rating | Key Evidence |
|---|---|---|
| New Entrants | Medium-High | Low capital requirements, but network effects and switching costs protect incumbents |
| Supplier Power | Low | Cloud infrastructure (AWS, Azure, GCP) is competitive; talent is the main constraint |
| Buyer Power | Low-Medium | High switching costs once implemented; 3-5 year contracts common |
| Substitutes | Low | Custom development is expensive; few alternatives for enterprise needs |
| Rivalry | Medium | Category leaders (Salesforce, Workday) hold strong positions; growth reduces share battles |
Synthesis: Favorable structure supports strong margins. Switching costs and differentiation protect incumbents. Key strategic focus: land and expand.
Example 3: Retail Grocery#
Grocery retail illustrates mixed forces and regional variation.
| Force | Rating | Key Evidence |
|---|---|---|
| New Entrants | Medium | Amazon/Whole Foods disrupted; but scale economics and real estate create barriers |
| Supplier Power | Low | Fragmented supplier base; retailers hold shelf space leverage |
| Buyer Power | High | Price-sensitive customers; easy to switch stores; weekly purchase decisions |
| Substitutes | Low-Medium | Restaurant delivery growing; meal kits emerged but plateaued |
| Rivalry | High | Walmart, Costco, regional chains compete intensely; low margins industry-wide |
Synthesis: High buyer power and rivalry compress margins. Winners need scale (Walmart) or differentiation (Trader Joe's, Whole Foods).
Five Forces vs Other Frameworks#
Five Forces vs SWOT#
| Dimension | Five Forces | SWOT |
|---|---|---|
| Focus | External industry structure | Internal + external factors |
| Level | Industry | Company |
| Output | Industry attractiveness | Company positioning |
| Best For | Market entry, industry analysis | Strategy formulation, quick assessment |
Use Five Forces for industry analysis, SWOT for company-specific strategy.
Five Forces vs PESTEL#
| Dimension | Five Forces | PESTEL |
|---|---|---|
| Focus | Industry competitive dynamics | Macro-environmental factors |
| Factors | Competitors, suppliers, buyers | Political, Economic, Social, Tech, Environmental, Legal |
| Time Horizon | Current structure | Long-term trends |
| Best For | Competitive strategy | Scenario planning, market entry |
Use PESTEL for macro trends, Five Forces for competitive dynamics. They complement each other well.
Five Forces vs Value Chain#
| Dimension | Five Forces | Value Chain |
|---|---|---|
| Focus | Industry structure | Company activities |
| Purpose | Understand profit potential | Identify competitive advantage |
| Output | Force ratings | Cost/differentiation sources |
| Best For | Industry attractiveness | Operational strategy |
Five Forces tells you if the industry is attractive. Value Chain tells you how to win within it.
Combining Frameworks#
In practice, consultants combine multiple frameworks. A comprehensive industry analysis might include:
- PESTEL — Macro-environmental context
- Five Forces — Industry competitive dynamics
- Value Chain — How value is created and captured
- MECE Issue Trees — Structure for specific strategic questions
Summary#
Porter's Five Forces remains the foundational framework for industry analysis four decades after its introduction. Used correctly, it reveals why some industries are profitable and others aren't—and what companies can do about it.
Key principles:
- Five forces determine industry profitability: New entrants, suppliers, buyers, substitutes, and rivalry
- Rate each force High/Medium/Low based on specific indicators and evidence
- Industry structure shapes company performance more than most realize
- Analysis must drive strategy — identify forces to exploit, shape, or mitigate
- Combine with other frameworks for comprehensive strategic analysis
For consulting presentations:
- Define industry scope precisely
- Use structured scoring for defensible ratings
- Quantify wherever possible
- Show trends, not just current state
- Connect analysis to strategic implications
The framework is simple. The value comes from rigorous application and insight generation. A well-executed Five Forces analysis tells a story about industry economics that shapes strategic decisions.
That's what separates a diagram from an analysis.
Build consulting slides in seconds
Describe what you need. AI generates structured, polished slides — charts and visuals included.
Try Free