BCG Matrix Template: The Complete Portfolio Analysis Guide
Learn how to create a BCG Matrix in PowerPoint. Covers Stars, Cash Cows, Question Marks, and Dogs with step-by-step instructions, formulas, and real-world examples.
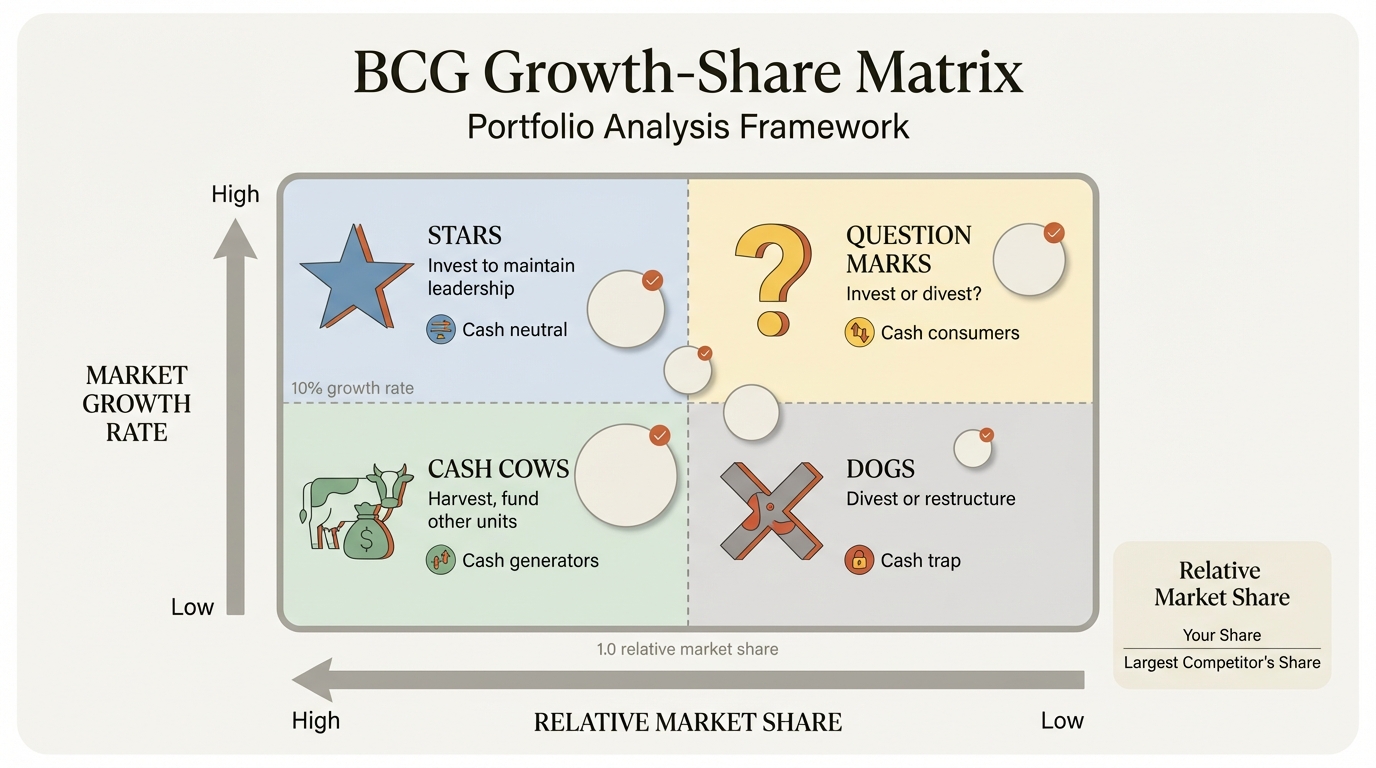
The BCG Matrix (Growth-Share Matrix) plots business units or products on two dimensions: market growth rate and relative market share. Developed by Boston Consulting Group in 1970, it categorizes portfolio elements into four quadrants—Stars, Cash Cows, Question Marks, and Dogs—each with distinct strategic implications for capital allocation.
If you're evaluating a product portfolio, making investment decisions across business units, or presenting strategic priorities to executives, the BCG Matrix provides a visual framework for complex resource allocation choices.
This guide covers how to calculate the metrics correctly, interpret each quadrant, avoid common mistakes, and build a BCG Matrix in PowerPoint that drives portfolio decisions. After applying the BCG Matrix to 30+ portfolio reviews, we've identified which quadrant transitions actually happen versus which are theoretical.
What Is the BCG Matrix?#
The BCG Matrix (also called the Growth-Share Matrix or Boston Matrix) is a strategic planning framework developed by Bruce Henderson at the Boston Consulting Group in 1970. It helps companies analyze their product portfolio and make resource allocation decisions.
The matrix plots business units or products on two dimensions:
| Dimension | What It Measures | Axis Position |
|---|---|---|
| Market Growth Rate | How fast the market is expanding | Y-axis (vertical) |
| Relative Market Share | Your share compared to the largest competitor | X-axis (horizontal) |
The defining insight of the BCG Matrix is that cash flow, not profit, determines strategic options. High-growth markets require cash investment to maintain position. High market share generates cash through economies of scale. The interaction of these two factors creates four distinct strategic categories.
This framework remains one of the most widely used portfolio analysis tools in corporate strategy, taught in every MBA program and used by Fortune 500 companies globally.
The Four Quadrants Explained#
The BCG Matrix divides products into four categories based on their position on the growth-share grid. Each quadrant has distinct characteristics, cash flow implications, and strategic recommendations.
| Quadrant | Market Growth | Market Share | Cash Flow | Strategic Priority |
|---|---|---|---|---|
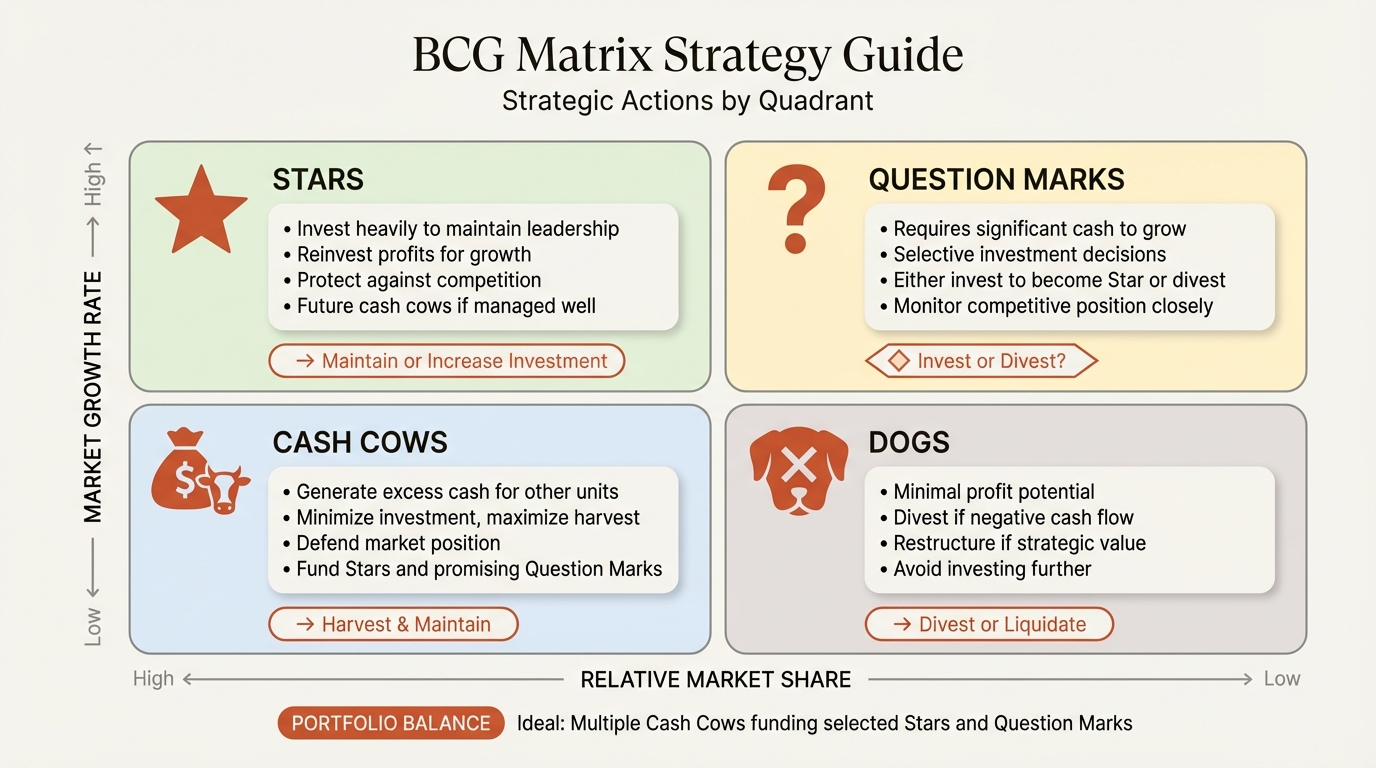
| Stars | High | High | Neutral (reinvest) | Invest to maintain leadership |
| Cash Cows | Low | High | Positive (generates cash) | Harvest, minimize investment |
| Question Marks | High | Low | Negative (consumes cash) | Invest selectively or divest |
| Dogs | Low | Low | Neutral to negative | Divest or restructure |
Understanding each quadrant is essential for making sound portfolio decisions.
Stars (High Growth, High Share)#
Stars are market leaders in rapidly growing industries. They generate substantial revenue but require significant reinvestment to maintain their competitive position as the market expands.
Characteristics:
- High revenue growth trajectory
- Substantial market share (relative market share > 1.0)
- Requires continuous investment to defend position
- Often cash-neutral despite high profitability
Strategic implications: Stars represent your future Cash Cows. The goal is to maintain or grow market share while the market is still expanding. Once market growth slows, a well-positioned Star transitions into a Cash Cow.
Real-world examples:
- Apple's iPhone in 2010-2015 (high-growth smartphone market, market leadership)
- Tesla's electric vehicle business (rapidly growing EV market, leading position)
- AWS in cloud computing (market leader in high-growth cloud infrastructure)
Common mistake: Underinvesting in Stars because they appear profitable. Stars need capital to maintain position—cutting investment allows competitors to catch up.
Cash Cows (Low Growth, High Share)#
Cash Cows are market leaders in mature, slow-growth markets. They generate more cash than they need to maintain their position, making them the financial engine of the portfolio.
Characteristics:
- Strong competitive position in stable markets
- High profit margins due to scale economies
- Minimal investment required to maintain share
- Primary source of cash for portfolio funding
Strategic implications: Cash Cows should be "milked"—their cash should fund Stars and promising Question Marks. Investment should be limited to what's necessary to maintain competitive position, not to chase growth that doesn't exist.
Real-world examples:
- Microsoft Office (dominant position in mature productivity software market)
- Coca-Cola's core beverage business (stable share in slow-growth carbonated drinks)
- P&G's established consumer brands (Tide, Pampers in mature categories)
Common mistake: Over-investing in Cash Cows to chase marginal growth. This misallocates capital that could generate higher returns in growing markets.
Question Marks (High Growth, Low Share)#
Question Marks (also called Problem Children or Wild Cards) operate in attractive, high-growth markets but lack the market share to generate positive cash flow. They represent strategic decisions: invest to build share, or exit before the market matures.
Characteristics:
- Attractive market with strong growth potential
- Weak competitive position (relative market share < 1.0)
- High investment requirements with uncertain returns
- Could become Stars or Dogs depending on execution
Strategic implications: Question Marks require careful analysis. Some deserve aggressive investment to build market share before the growth window closes. Others should be divested—not every high-growth market is winnable. The key question is: can we realistically achieve market leadership?
Real-world examples:
- Apple TV+ in streaming (high-growth market, low share vs Netflix/Disney)
- Samsung's foldable phones (emerging category, position still uncertain)
- Many corporate venture investments in adjacent markets
Common mistake: Spreading resources across too many Question Marks. Better to invest heavily in 2-3 winnable opportunities than to underinvest across 10.
Dogs (Low Growth, Low Share)#
Dogs have weak competitive positions in slow-growth or declining markets. They typically generate minimal cash flow and tie up capital and management attention that could be deployed elsewhere.
Characteristics:
- Limited growth potential in the market
- Weak competitive position with no clear path to leadership
- May generate cash but often break-even or loss-making
- Consume management time disproportionate to their value
Strategic implications: Dogs are typically candidates for divestiture, liquidation, or repositioning. The exception is when a Dog serves a strategic purpose (completing a product line, serving a key customer segment) or can be turned around through restructuring.
Real-world examples:
- iPod in Apple's current portfolio (declining market, declining share)
- Many legacy product lines in diversified industrials
- Regional brands in consolidating consumer goods categories
Common mistake: Holding Dogs for emotional or legacy reasons. "We've always had this business" is not a strategy. Every Dog consumes resources that could fund growth elsewhere.
When to Use the BCG Matrix#
The BCG Matrix is most effective in specific strategic contexts. Understanding when to use it—and when to choose alternative frameworks—improves the quality of your analysis.
Ideal Use Cases#
| Scenario | Why BCG Matrix Works |
|---|---|
| Portfolio resource allocation | Clear framework for capital budgeting across business units |
| Strategic planning sessions | Visual tool that facilitates executive discussion |
| M&A target screening | Quick categorization of acquisition candidates |
| Product line rationalization | Identifies candidates for divestiture |
| Corporate strategy reviews | High-level view of portfolio balance |
When to Use Alternative Frameworks#
The BCG Matrix has limitations. Consider alternatives in these situations:
| Situation | Better Alternative |
|---|---|
| Need to analyze multiple factors beyond growth/share | GE McKinsey Matrix (9-cell, multi-factor) |
| Analyzing growth strategies for a single product | Ansoff Matrix (market/product expansion) |
| Evaluating competitive dynamics | Porter's Five Forces |
| New market entry decisions | SWOT Analysis combined with market research |
| Small portfolio with 2-3 products | Direct financial analysis |
The BCG Matrix provides high-level strategic guidance. It's a starting point for discussion, not a replacement for detailed analysis.
Continue reading: Bullet Charts in PowerPoint · Deloitte Presentation Template · Traction Slide
Build consulting slides in seconds
Describe what you need. AI generates structured, polished slides — charts and visuals included.
How to Build a BCG Matrix (Step-by-Step)#
Building a BCG Matrix requires gathering the right data, calculating the key metrics, and plotting products on the grid. Here's the process used in consulting engagements.
Step 1: Define Your Portfolio Scope#
Decide what you're analyzing:
- Business units within a corporation
- Product lines within a business unit
- Individual products within a product line
- Geographic markets for a single product
The scope determines the level of granularity and the relevant market definitions.
Step 2: Gather Market Data#
For each product or business unit, collect:
| Data Point | Source |
|---|---|
| Your revenue/sales | Internal financial data |
| Total market size | Industry reports (Gartner, IBISWorld, Statista) |
| Market growth rate | Industry reports, analyst estimates |
| Largest competitor's market share | Competitive intelligence, earnings reports |
Step 3: Calculate the Metrics#
For Market Growth Rate (Y-axis):
Market Growth Rate = (Current Year Market Size - Prior Year Market Size) / Prior Year Market Size
For Relative Market Share (X-axis):
Relative Market Share = Your Market Share / Largest Competitor's Market Share
Step 4: Set the Axis Thresholds#
Standard thresholds (adjust based on your industry):
| Metric | Low/High Threshold |
|---|---|
| Market Growth Rate | 10% (markets growing >10% are "high growth") |
| Relative Market Share | 1.0 (share > largest competitor is "high share") |
Industry context matters. In fast-moving tech, 10% growth might be "low." In mature industrials, 3% growth could be "high."
Step 5: Plot Products on the Matrix#
Position each product based on its calculated metrics:
- X-axis: Relative market share (typically log scale, high share on left)
- Y-axis: Market growth rate (high growth on top)
Step 6: Size Bubbles by Revenue (Optional)#
For bubble charts, size each circle proportionally to revenue. This adds a third dimension showing the relative importance of each product to the portfolio.
Calculating Market Share and Growth Rate#
Getting the calculations right is critical. Incorrect data leads to incorrect strategic conclusions.
Relative Market Share Formula#
Formula: Relative Market Share = Your Market Share / Largest Competitor's Market Share
Example calculation:
| Company | Market Share | Calculation | Relative Share |
|---|---|---|---|
| Your Company | 25% | 25% / 30% | 0.83 |
| Competitor A | 30% | 30% / 25% | 1.20 |
| Competitor B | 20% | 20% / 30% | 0.67 |
| Competitor C | 15% | 15% / 30% | 0.50 |
| Others | 10% | — | — |
Interpretation:
- Relative share > 1.0 = You are the market leader
- Relative share = 1.0 = You are tied with the leader
- Relative share < 1.0 = You trail the market leader
Market Growth Rate Formula#
Formula: Market Growth Rate = (Current Period Size - Prior Period Size) / Prior Period Size
Example calculation:
| Year | Market Size | Calculation | Growth Rate |
|---|---|---|---|
| 2024 | $10.0B | — | — |
| 2025 | $11.2B | (11.2 - 10.0) / 10.0 | 12% |
| 2026 | $12.5B | (12.5 - 11.2) / 11.2 | 11.6% |
Key considerations:
- Use unit sales if price changes distort revenue growth
- Use consistent market definitions across products
- Consider using CAGR (Compound Annual Growth Rate) for multi-year view
Defining the Market Correctly#
Market definition dramatically affects your results. A product could be a Dog in a broad market but a Star in a narrow segment.
| Broad Definition | Narrow Definition | Impact |
|---|---|---|
| Passenger vehicles | Luxury electric SUVs | Market share increases |
| Cloud computing | Infrastructure-as-a-Service | Growth rate may change |
| Consumer beverages | Premium energy drinks | Competitive position changes |
Choose the market definition that reflects how customers make purchase decisions and how you actually compete.
BCG Matrix Best Practices#
After building hundreds of portfolio matrices in consulting, these practices consistently improve analysis quality.
Use Bubble Charts for Richer Analysis#
Standard quadrant diagrams work for simple presentations. For detailed analysis, use bubble charts where:
- X-axis = Relative market share
- Y-axis = Market growth rate
- Bubble size = Revenue or profit contribution
This shows portfolio composition at a glance—large bubbles in the Cash Cow quadrant indicate a healthy portfolio; large bubbles in Question Marks indicate high risk.
Apply Consistent Market Definitions#
If you're comparing business units, ensure market definitions are comparable. A business unit that defines its market narrowly will appear to have higher share than one using broad definitions.
Update Annually#
Markets evolve. Today's Star could be tomorrow's Cash Cow. Today's Question Mark might become a Dog if share doesn't improve. Revisit the matrix at least annually.
Combine with Financial Analysis#
The BCG Matrix indicates strategic direction but doesn't replace financial analysis. Validate quadrant classifications with:
- Return on invested capital (ROIC)
- Cash flow generation
- Competitive moat analysis
Present Trajectories, Not Just Snapshots#
Show where products are moving, not just where they are. An arrow from Question Mark toward Star tells a different story than an arrow toward Dog.
Common BCG Matrix Mistakes#
These errors frequently undermine BCG Matrix analysis in corporate strategy settings.
Mistake 1: Using Absolute Market Share#
Problem: Plotting products based on percentage market share (e.g., "We have 15% share") Fix: Always use relative market share (your share divided by the largest competitor's share)
Absolute share doesn't indicate competitive position. 15% share in a fragmented market with no competitor above 10% is different from 15% share where the leader has 50%.
Mistake 2: Ignoring Market Definition#
Problem: Using inconsistent or inappropriate market definitions Fix: Define markets based on substitutability and competitive dynamics
The market should include all products that customers consider when making purchase decisions.
Mistake 3: Static Analysis#
Problem: Treating the matrix as a fixed picture rather than dynamic positions Fix: Show historical movement and projected trajectories
Products move through the matrix over time. Show direction of travel, not just current position.
Mistake 4: Mechanical Strategy Application#
Problem: "It's a Dog, so divest it" without considering strategic context Fix: Use the matrix as input to strategy, not as the strategy itself
Some Dogs serve strategic purposes (completing a product line, serving a key account). Some Cash Cows deserve investment if competitive threats emerge.
Mistake 5: Overcomplicating the Visualization#
Problem: Adding too many products, segments, or annotations Fix: Focus on the 10-15 most significant portfolio elements
If your BCG Matrix has 50 bubbles, no one can interpret it. Aggregate smaller products into categories.
Mistake 6: Neglecting Cash Flow Implications#
Problem: Focusing only on classification without discussing capital allocation Fix: Explicitly state the cash flow implications of each quadrant
The BCG Matrix exists to guide resource allocation. Every presentation should include investment recommendations.
Creating BCG Matrix in PowerPoint#
PowerPoint can create BCG matrices, though the approach differs based on whether you need a simple diagram or a data-driven visualization.
Method 1: Simple 2x2 Diagram (Basic)#
For presentations where exact product positions don't matter, use shapes:
- Insert a large square shape
- Add two lines to divide it into quadrants
- Label each quadrant (Stars, Cash Cows, Question Marks, Dogs)
- Add text boxes or shapes to represent products
- Add axis labels (Market Growth Rate, Relative Market Share)
Time required: 10-15 minutes Best for: Conceptual explanations, teaching the framework
Method 2: Excel-Linked Scatter Chart (Data-Driven)#
For precise product positioning based on actual data:
- Prepare data in Excel (Product name, Relative Share, Growth Rate, Revenue)
- Create a scatter chart or bubble chart in Excel
- Add quadrant lines using axis formatting or secondary series
- Copy and paste into PowerPoint (linked or embedded)
Time required: 30-45 minutes Best for: Detailed portfolio analysis, board presentations
Method 3: PowerPoint Add-ins (Recommended)#
Add-ins like Deckary streamline the process with purpose-built charting tools. Deckary's scatter and bubble chart capabilities allow you to:
- Create data-driven BCG matrices with proper axis scaling
- Size bubbles by revenue automatically
- Link to Excel for live data updates
- Format with consulting-standard styling
| Method | Time Required | Data Accuracy | Ease of Updates |
|---|---|---|---|
| Shapes only | 10-15 min | Low (manual positioning) | Difficult |
| Excel chart | 30-45 min | High | Moderate |
| Deckary | 5-10 min | High | Easy (Excel-linked) |
For consultants and strategists who build portfolio analyses regularly, Deckary offers bubble charts and scatter charts at $49-119/year—a fraction of think-cell's $299/year pricing.
Real-World BCG Matrix Examples#
Understanding how major companies apply the BCG Matrix illuminates the framework's practical value.
Example 1: Apple Product Portfolio#
| Product | Market Growth | Relative Share | Quadrant |
|---|---|---|---|
| iPhone | Moderate (slowing) | High (leader in premium) | Cash Cow (transitioning) |
| Mac | Low | Moderate | Cash Cow |
| iPad | Low | High | Cash Cow |
| Apple Watch | Moderate | High | Star |
| Services (App Store, iCloud) | High | High | Star |
| Vision Pro | High (emerging) | Uncertain | Question Mark |
| iPod (discontinued) | Negative | Declining | Dog (divested) |
Apple's portfolio shows classic BCG dynamics: mature products (Mac, iPad) fund investment in growth areas (Services, Wearables).
Example 2: Amazon Business Units#
| Business Unit | Market Growth | Relative Share | Quadrant |
|---|---|---|---|
| AWS | High | High | Star |
| E-commerce (North America) | Moderate | High | Cash Cow |
| Prime Video | High | Moderate | Question Mark |
| Alexa/Echo devices | Moderate | Moderate | Question Mark |
| Amazon Pharmacy | High | Low | Question Mark |
| Kindle | Low | High | Cash Cow |
Amazon's strategy is clear: AWS is the Star driving growth, e-commerce is the Cash Cow funding expansion, and multiple Question Marks represent bets on future growth categories.
Example 3: Hypothetical Industrial Conglomerate#
| Business Unit | Revenue ($M) | Market Growth | Rel. Share | Quadrant | Recommendation |
|---|---|---|---|---|---|
| Industrial Automation | 450 | 8% | 1.4 | Cash Cow | Maintain, harvest |
| IoT Solutions | 120 | 22% | 0.6 | Question Mark | Invest or partner |
| Legacy Equipment | 280 | -2% | 0.8 | Dog | Restructure or divest |
| Robotics Division | 180 | 18% | 1.2 | Star | Aggressive investment |
| Maintenance Services | 340 | 4% | 1.1 | Cash Cow | Optimize margins |
This analysis reveals a portfolio that needs rebalancing: too much capital tied up in the declining Legacy Equipment business, and the IoT Solutions question mark needs a clear invest-or-exit decision.
BCG Matrix vs Other Frameworks (GE Matrix, Ansoff)#
The BCG Matrix is one of several portfolio analysis frameworks. Understanding when to use each improves your strategic analysis.
BCG Matrix vs GE McKinsey Matrix#
| Dimension | BCG Matrix | GE McKinsey Matrix |
|---|---|---|
| Structure | 2x2 (4 cells) | 3x3 (9 cells) |
| Factors considered | 2 (growth, share) | Multiple per axis |
| Complexity | Simple | Complex |
| Time to create | 1-2 hours | 4-8 hours |
| Best for | Quick portfolio screening | Detailed strategic analysis |
| Subjectivity | Low (data-driven) | Higher (weighted factors) |
When to choose BCG: Need quick analysis, have clear market data, want to facilitate executive discussion.
When to choose GE McKinsey: Need nuanced analysis, market share alone doesn't capture competitive position, want to weight multiple strategic factors.
BCG Matrix vs Ansoff Matrix#
| Dimension | BCG Matrix | Ansoff Matrix |
|---|---|---|
| Purpose | Evaluate existing portfolio | Plan growth strategies |
| Focus | Current products/markets | Future expansion options |
| Axes | Growth rate / Market share | Product (existing/new) / Market (existing/new) |
| Output | Investment priorities | Growth direction |
The Ansoff Matrix answers "How should we grow?" while the BCG Matrix answers "Where should we invest in our current portfolio?"
When to Combine Frameworks#
The most effective strategic analysis combines frameworks:
- BCG Matrix to assess current portfolio health
- GE McKinsey Matrix to deep-dive on Question Marks
- Ansoff Matrix to explore growth options for Stars and Cash Cows
- Porter's Five Forces to understand competitive dynamics in each market
No single framework provides complete strategic guidance. The BCG Matrix is a starting point, not the destination.
Summary#
The BCG Matrix remains one of the most powerful tools for portfolio strategy. Developed by Boston Consulting Group over 50 years ago, it continues to guide capital allocation decisions at Fortune 500 companies worldwide.
Key takeaways:
-
The BCG Matrix plots products on two dimensions: market growth rate (Y-axis) and relative market share (X-axis)
-
Four quadrants define strategic categories: Stars (invest), Cash Cows (harvest), Question Marks (selective investment or divestiture), and Dogs (divest or restructure)
-
Relative market share, not absolute share, determines position: Calculate by dividing your share by the largest competitor's share
-
Market definition matters: Narrow definitions inflate market share; broad definitions dilute it
-
Use the matrix dynamically: Show product trajectories over time, not just current positions
-
Combine with financial analysis: The matrix indicates direction but doesn't replace ROIC, cash flow, and competitive analysis
-
PowerPoint add-ins accelerate creation: Tools like Deckary with scatter and bubble chart capabilities reduce BCG Matrix creation time from hours to minutes
For consultants and corporate strategists building portfolio analyses, the right tools matter. Deckary offers professional charting capabilities at $49-119/year with a 14-day free trial—no credit card required.
Build consulting slides in seconds
Describe what you need. AI generates structured, polished slides — charts and visuals included.
Try Free