Create native PowerPoint charts with Deckary
Create editable PowerPoint charts with embedded workbook data, consulting display controls, and optional links to Excel ranges.
Last verified: 2026-09-09
Deckary creates bar, 100% stacked bar, waterfall, Mekko, line, scatter, and pie charts as native PowerPoint charts with embedded Excel workbook data. These charts remain editable in PowerPoint. Gantt charts use grouped PowerPoint shapes because their activity and timescale layout differs from a standard Office chart.
Supported chart families
| Chart | Output | Notable behavior |
|---|---|---|
| Bar | Native PowerPoint chart | Vertical or horizontal; clustered or stacked |
| 100% stacked bar | Native PowerPoint chart | Normalizes displayed values to 100% |
| Waterfall | Native PowerPoint chart | Supports explicit base and total roles |
| Mekko / Marimekko | Native PowerPoint chart | Uses column widths and segments to show composition |
| Line | Native PowerPoint chart | Lines, markers, smoothing, and trendlines |
| Scatter | Native PowerPoint chart | Uses numeric x-values and numeric axes |
| Pie | Native PowerPoint chart | Single-series native 2-D pie |
| Gantt | Grouped PowerPoint shapes | Date range, timescale, groups, activities, and labels |
Insert a chart
- Open the destination slide and choose Deckary → Charts.
- Choose a chart type from the icons at the top of the pane. Hover over an icon to identify the family. Clustered Bar and Stacked Bar are separate choices.
- Choose Edit data to enter values manually, or Use Excel data to select a published source.
- Check the row and series counts, then choose the insertion button, such as Insert Clustered Bar.
- Wait for the chart to appear, review it on the slide, and save the presentation.
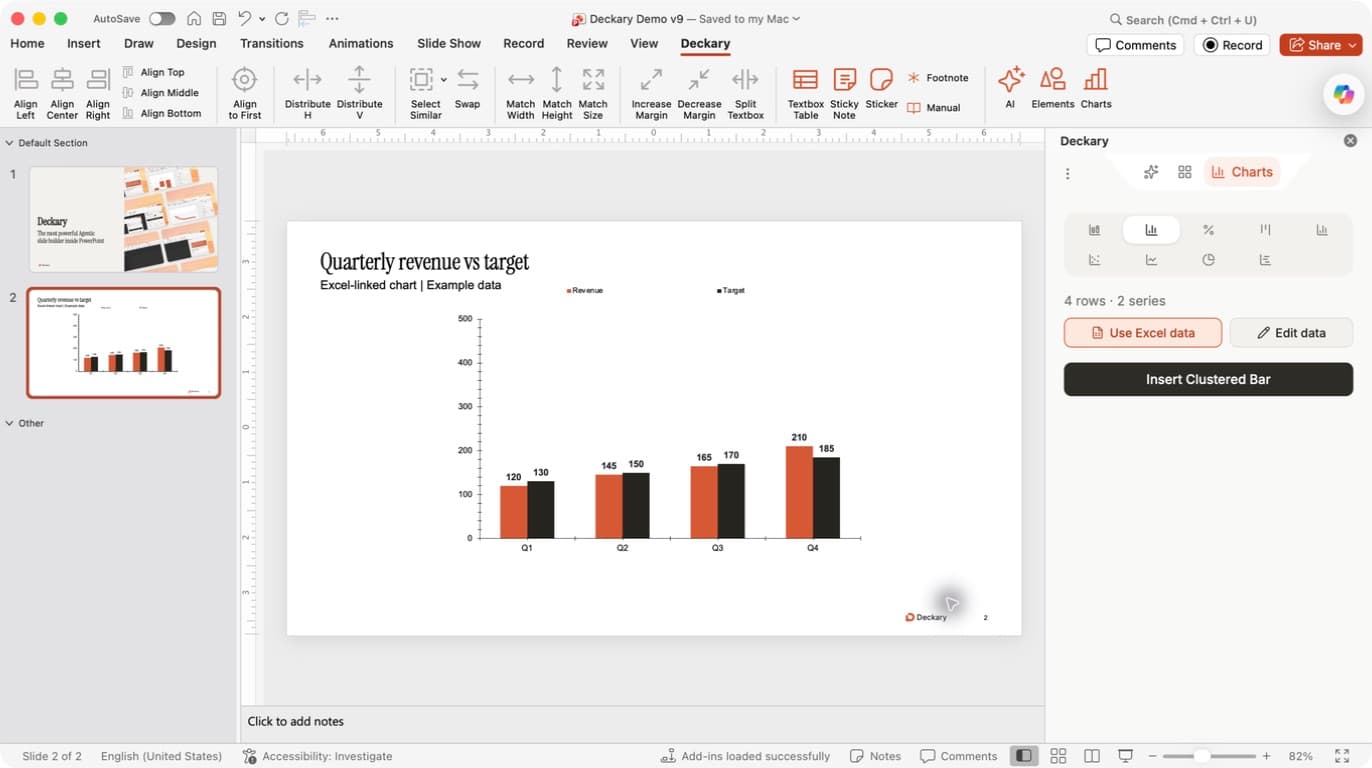
Insert versus edit: the screenshot shows Insert Clustered Bar because no existing chart is selected. The chart already visible on the slide is not the target of this insertion. To edit it, select that chart first and check that its settings load in the pane.
Open Deckary's Charts pane, choose a chart family, then provide data manually or select an available Excel link. Deckary validates the data and chart configuration before inserting the chart on the active slide.
Native charts can use titles, legends, data labels, number formats, category ordering, and palette controls. Some consulting treatments that Office does not represent directly—such as delta brackets or waterfall connectors—are stored as chart overlay shapes while the main chart remains native.
Edit an existing Deckary chart
Select the chart to load its current Deckary configuration. Changes preserve the chart's logical identity and the position or size adjustments you made in PowerPoint. Deckary replaces the internal chart package parts as one transaction and verifies that PowerPoint reimported the expected chart before reporting success.
Copied charts are handled separately. When two shapes initially share the same Deckary identity, the add-in assigns the copy a new chart and instance identity before either one is edited.
Format a selected chart
- Select the Deckary chart on the slide and return to the Deckary ribbon tab if PowerPoint opens a contextual chart tab.
- In the Charts pane, expand a section such as Title, Colors, Axes, Data Labels, or Legend.
- Change one setting, let Deckary finish applying it, and inspect the chart before continuing.
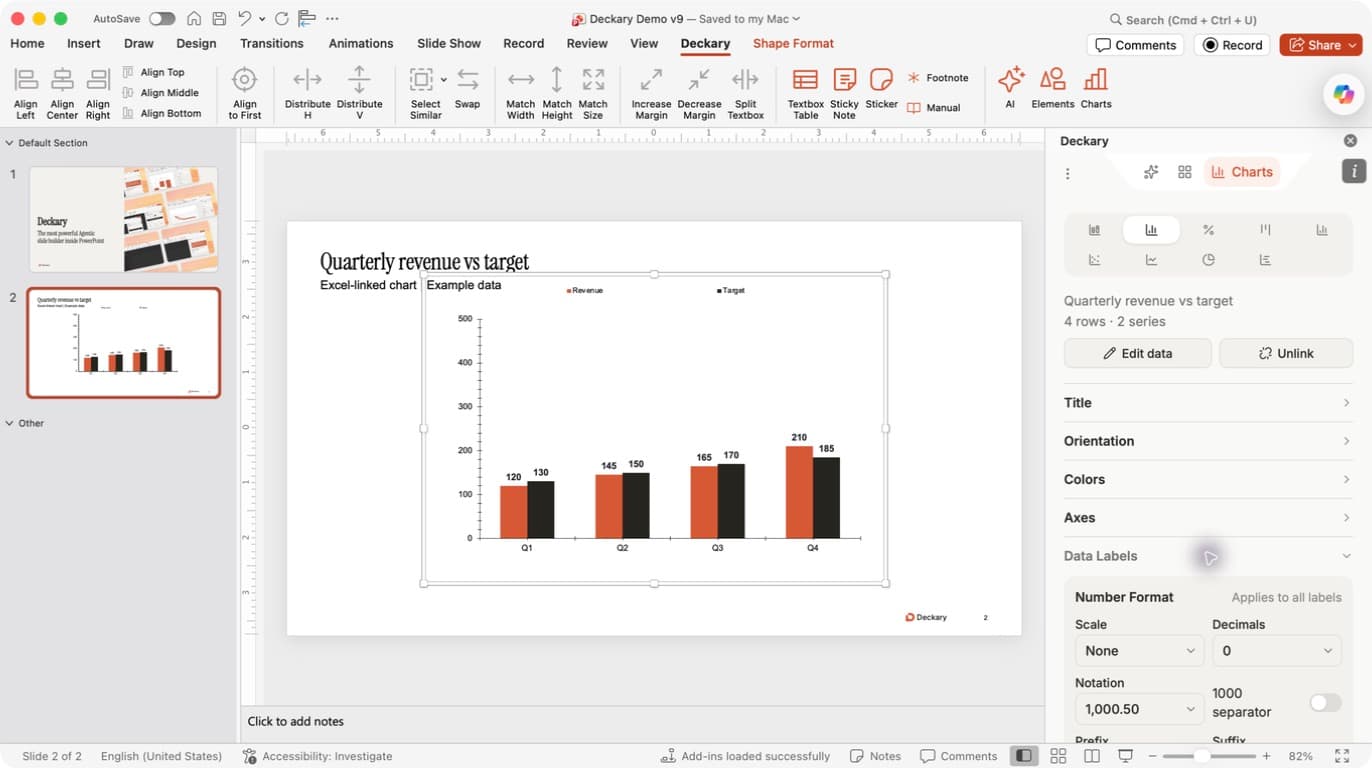
Format the labels: Scale controls how large numbers are displayed, Decimals controls precision, and Notation and the separator switch control numeric presentation. These are display choices; they do not replace the underlying values. Scroll within the pane to reach further controls.
Keep the data source in mind: this chart shows Quarterly revenue vs target because it is Excel-linked. Formatting can preserve that link. Saving manual values through Edit data disconnects it; change the original worksheet values and refresh the source when Excel should remain authoritative. See the complete Excel-linking workflow.
If you choose a different chart type, review any conversion notice before accepting. Different families can interpret columns differently or drop incompatible annotations. Cancel a conversion if its proposed changes do not match your intent.
Use charts with the AI slide builder
The PowerPoint AI agent can create and edit the supported native chart families inside its normal slide-authoring workflow. Gantt uses a separate timeline workflow rather than the numeric chart-editing controls. For the broader slide process, see Build and edit PowerPoint slides with AI.