PESTLE Analysis Template for PowerPoint: The Complete Guide
Create professional PESTLE analysis presentations with our free template. Learn the six factors, best practices, and real-world examples for strategic planning.
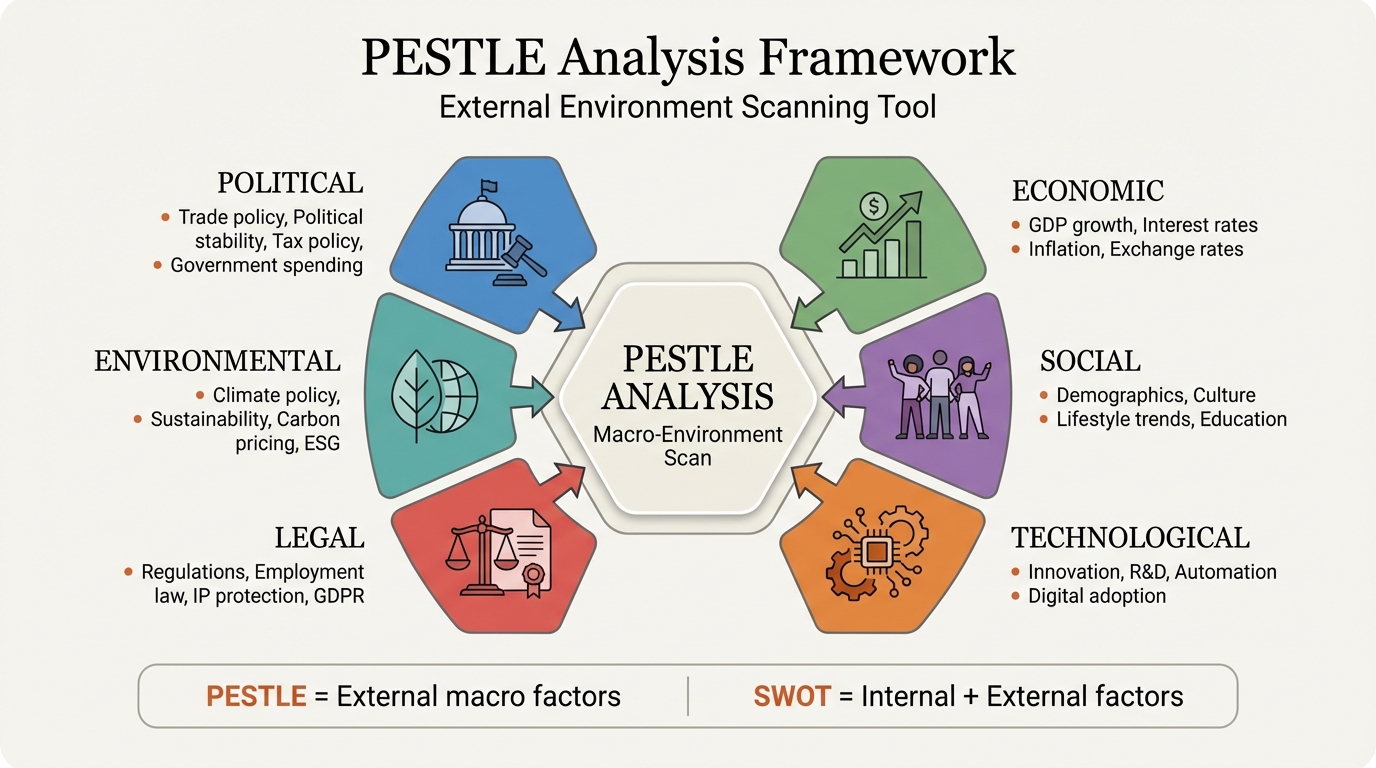
PESTLE analysis is a strategic framework for evaluating the macro-environmental factors that impact an organization, industry, or market: Political, Economic, Social, Technological, Legal, and Environmental. Unlike internal analysis tools, PESTLE focuses exclusively on external factors largely outside a company's control.
If you're making market entry decisions, conducting strategic planning, or assessing risks before major investments, a PESTLE analysis systematically identifies the external forces that could create opportunities or threaten your plans before they materialize.
This guide covers the six factors in detail, step-by-step methodology, PowerPoint formatting best practices, and how to combine PESTLE with other frameworks like SWOT and Porter's Five Forces.
After conducting PESTLE analyses for 35+ market entry and strategic planning engagements, we've identified which factors matter most by industry and which presentation formats help executives prioritize external risks rather than filing the analysis away unread.
What Is PESTLE Analysis?#
PESTLE analysis is a strategic framework for evaluating the macro-environmental factors that impact an organization, industry, or market. The acronym stands for:
- Political
- Economic
- Social
- Technological
- Legal
- Environmental
Unlike internal analysis tools, PESTLE focuses exclusively on external factors that are largely outside a company's control. It helps strategists understand the broader context in which a business operates and identify opportunities and threats before they materialize.
The framework originated in the 1960s as PEST analysis (without Legal and Environmental). As regulatory complexity and sustainability concerns grew, consultants expanded it to PESTLE—sometimes spelled PESTEL—to capture these critical dimensions.
| Variation | Factors Included | Best For |
|---|---|---|
| PEST | Political, Economic, Social, Technological | Quick scans, stable industries |
| PESTLE/PESTEL | All six factors | Comprehensive analysis, regulated industries |
| STEEPLE | Adds Ethical | Values-driven organizations |
| LONGPEST | Adds Local, National, Global | Multi-geography analysis |
For most consulting and corporate strategy work, PESTLE provides the right balance of comprehensiveness and practicality.
The Six PESTLE Factors#
Each PESTLE factor represents a distinct category of external forces. Understanding what belongs in each bucket is essential for building MECE structures that don't overlap or leave gaps.
Political Factors#
Political factors relate to government policy, political stability, and the degree of government intervention in the economy.
Key questions to answer:
- How stable is the current government?
- What is the government's stance toward our industry?
- Are there upcoming elections that could shift policy?
- What trade agreements or restrictions affect our operations?
- How does government spending impact our market?
Examples of political factors:
| Factor | Impact Example |
|---|---|
| Trade tariffs | US-China tariffs increased Tesla's imported component costs by 25% |
| Government incentives | US Inflation Reduction Act provides $7,500 tax credits for EV purchases |
| Political stability | Brexit uncertainty caused 15% decline in UK foreign direct investment |
| Lobbying environment | Pharmaceutical industry spends $300M annually on US lobbying |
| Nationalization risk | Argentina's 2012 YPF nationalization affected oil industry investment |
Industry-specific considerations:
- Defense: Government procurement policies and defense budgets
- Healthcare: Single-payer vs. private insurance political debates
- Energy: Carbon policies and renewable energy subsidies
- Technology: Data privacy legislation and antitrust enforcement
Economic Factors#
Economic factors encompass macroeconomic conditions that affect consumer spending, business investment, and overall market demand.
Key questions to answer:
- What is the current and projected GDP growth rate?
- How are interest rates trending?
- What is the inflation outlook?
- What is the unemployment rate and wage growth?
- How are exchange rates affecting our business?
Examples of economic factors:
| Factor | Impact Example |
|---|---|
| Interest rates | Higher rates in 2023 reduced Tesla lease applications by 24% |
| Inflation | UK's 11% inflation in 2022 shifted consumer spending from discretionary to essentials |
| Exchange rates | Strong dollar in 2022 reduced US export competitiveness by 15% |
| Consumer confidence | Low confidence during recessions delays large purchase decisions |
| Credit availability | Tight lending standards limit business expansion and consumer financing |
Why economic factors matter:
Economic conditions directly impact both demand (consumer purchasing power) and supply (cost of capital, input prices). A thorough economic analysis often requires segmenting by geography, as conditions vary significantly across markets.
Social Factors#
Social factors—also called sociocultural factors—relate to demographic trends, cultural attitudes, lifestyle changes, and consumer behavior patterns.
Key questions to answer:
- How is the population's age distribution changing?
- What cultural values influence purchasing decisions?
- How are lifestyle and consumption patterns shifting?
- What are the education and skill levels in the workforce?
- How do health and wellness trends affect our products?
Examples of social factors:
| Factor | Impact Example |
|---|---|
| Aging population | Japan's 29% over-65 population creates demand for healthcare robotics |
| Remote work shift | COVID-19 accelerated remote work, increasing home office equipment sales by 300% |
| Health consciousness | Plant-based food market grew 27% annually from 2019-2024 |
| Urbanization | 68% of world population projected urban by 2050, driving smart city investment |
| Social media influence | 72% of Gen Z purchasing decisions influenced by social media content |
Capturing social nuance:
Social factors are often the hardest to quantify. Effective PESTLE analysis combines demographic data with qualitative research on attitudes and behaviors. When entering new markets, cultural misreads are among the most common—and costly—strategic errors.
Technological Factors#
Technological factors assess how technological change creates opportunities and threats for the business or industry.
Key questions to answer:
- What emerging technologies could disrupt our industry?
- How is technology changing customer expectations?
- What is the rate of technology adoption in our market?
- How are competitors using technology?
- What R&D investment is required to stay competitive?
Examples of technological factors:
| Factor | Impact Example |
|---|---|
| AI/Machine learning | ChatGPT reached 100M users in 2 months, faster than any previous technology |
| 5G deployment | Enables new applications in IoT, autonomous vehicles, and remote surgery |
| Cloud computing | AWS, Azure, and GCP now host 60% of enterprise workloads |
| E-commerce | Online retail grew from 16% to 22% of total retail 2019-2024 |
| Cybersecurity | Average data breach cost reached $4.5M in 2023 |
Technology assessment framework:
When analyzing technological factors, consider both the threat of disruption to existing business models and the opportunity to leverage new technologies. The best PESTLE analyses include a time horizon: what technologies matter now versus in 3-5 years?
Legal Factors#
Legal factors cover laws and regulations that directly affect business operations. While related to political factors, legal factors focus on existing legislation rather than political trends.
Key questions to answer:
- What industry-specific regulations apply?
- What are the employment law requirements?
- What intellectual property protections exist?
- What consumer protection laws affect our products?
- What are the data privacy and security requirements?
Examples of legal factors:
| Factor | Impact Example |
|---|---|
| Data privacy (GDPR) | GDPR fines exceeded $2.5B in first five years |
| Employment law | California's AB5 reclassified gig workers, impacting Uber's cost structure |
| Antitrust | FTC's increased scrutiny blocked multiple tech acquisitions 2021-2024 |
| Product liability | Johnson & Johnson's talc litigation resulted in $8.9B settlement |
| Environmental regulations | EU's Carbon Border Adjustment Mechanism adds import costs |
Legal vs. Political distinction:
Legal factors are current laws on the books. Political factors are the policy debates and potential future changes. Both matter, but they require different analytical approaches—legal factors need compliance assessment, political factors need scenario planning.
Environmental Factors#
Environmental factors address ecological and environmental aspects that influence business operations and strategic decisions.
Key questions to answer:
- What is our industry's environmental footprint?
- How do climate-related risks affect operations?
- What sustainability expectations do stakeholders have?
- How are resource scarcity and commodity prices trending?
- What carbon reduction requirements apply?
Examples of environmental factors:
| Factor | Impact Example |
|---|---|
| Climate commitments | 90% of global economy now covered by net-zero targets |
| Carbon pricing | EU carbon prices reached $100/ton in 2023 |
| Extreme weather | Supply chain disruptions from weather events cost $82B in 2023 |
| Circular economy | EU's Right to Repair regulations require 10-year parts availability |
| ESG investing | $35T in assets now under ESG-focused management |
Environmental factor evolution:
Environmental factors have moved from "nice to have" to strategic imperatives. For many industries, carbon transition represents the largest transformation in decades. Tesla's PESTLE analysis, for example, shows environmental factors as primarily opportunity-driven, while traditional automakers face significant transition risk.
When to Use PESTLE Analysis#
PESTLE analysis is most valuable in specific strategic contexts. Using it at the wrong time wastes effort; using it at the right time prevents costly mistakes.
High-value use cases:
| Scenario | Why PESTLE Adds Value |
|---|---|
| Market entry | Identifies unfamiliar external risks before committing resources |
| Strategic planning | Provides macro context for 3-5 year planning horizons |
| M&A due diligence | Surfaces external factors that affect target valuation |
| Investment decisions | Assesses external environment before major capital allocation |
| Crisis response | Identifies interconnected external pressures during disruption |
| Annual strategy refresh | Updates assumptions about external environment |
When NOT to use PESTLE:
- Tactical, short-term decisions (use operational frameworks instead)
- Internal process improvement (use value chain or process analysis)
- Competitive positioning (use Porter's Five Forces)
- Product development (use customer research and market sizing)
PESTLE is a macro tool. It works best when you need to understand the forest, not examine individual trees.
Continue reading: Bullet Charts in PowerPoint · Deloitte Presentation Template · Traction Slide
Build consulting slides in seconds
Describe what you need. AI generates structured, polished slides — charts and visuals included.
How to Conduct PESTLE Analysis#
A rigorous PESTLE analysis follows a structured process. Here's the step-by-step methodology we developed across 30+ market entry and strategic planning engagements.
Step 1: Define Scope and Time Horizon#
Before gathering data, clarify what you're analyzing:
- Geographic scope: Which countries or regions?
- Industry scope: Broad industry or specific segment?
- Time horizon: Current state, 1-2 years, or 5+ years?
- Purpose: Market entry, risk assessment, or strategic planning?
Scope determines which factors matter most. A global pharmaceutical company entering Brazil cares about different political factors than a local restaurant chain.
Step 2: Gather Data for Each Factor#
Research each PESTLE dimension systematically. Use multiple source types:
| Source Type | Examples | Best For |
|---|---|---|
| Government sources | Central bank reports, ministry publications | Economic, Political, Legal |
| Industry reports | Gartner, McKinsey, Forrester | Technological, Industry trends |
| News monitoring | Reuters, Financial Times, industry press | Emerging changes |
| Academic research | Journal articles, university studies | Social, Environmental |
| Expert interviews | Industry veterans, local market experts | Nuanced context |
| Company filings | SEC filings, sustainability reports | Competitive intelligence |
Practical tip: Assign each PESTLE factor to a team member. This ensures parallel data gathering and prevents scope creep.
Step 3: Identify Key Factors#
Not all factors matter equally. After gathering data, prioritize based on:
- Impact: How significantly could this factor affect the business?
- Likelihood: How probable is this factor changing?
- Timing: Is this imminent or long-term?
We typically use a 2x2 matrix (Impact vs. Likelihood) to identify the 8-12 factors that warrant strategic attention. Everything else becomes background context.
Step 4: Analyze Implications#
For each priority factor, answer:
- What is the trend? Is this factor improving, stable, or deteriorating?
- What are the implications? How does this affect our business specifically?
- What is the time horizon? When will this impact materialize?
- What actions does this suggest? What should we do differently?
This step transforms data collection into strategic insight. Raw PESTLE lists without implications are not useful for decision-making.
Step 5: Document and Communicate#
Package findings for stakeholder consumption. This typically includes:
- Executive summary: 3-5 most critical factors and implications
- Detailed PESTLE table: All factors with supporting evidence
- Implications summary: Strategic recommendations based on analysis
- Appendix: Source documentation for key claims
The presentation format matters. We'll cover PowerPoint-specific formatting in a later section.
Step 6: Establish Review Cadence#
PESTLE analysis is not a one-time exercise. External environments change. Establish:
- Quarterly reviews: Scan for major changes in priority factors
- Annual refresh: Comprehensive update of all factors
- Trigger-based updates: New analysis when major events occur
For fast-moving industries (technology, regulatory-intensive sectors), more frequent reviews are warranted.
PESTLE Analysis Best Practices#
Based on conducting PESTLE analyses across 30+ engagements, these practices separate useful analysis from checkbox exercises.
Be Specific, Not Generic#
Weak: "Political instability could affect operations" Strong: "Upcoming 2024 election could shift renewable energy policy; opposition party's platform includes 40% subsidy reduction"
Generic factors don't enable decisions. Specific factors with quantified implications do.
Focus on Change, Not State#
The most valuable PESTLE insights come from factors that are changing. A stable regulatory environment is background context. A regulatory environment about to change is strategic intelligence.
Ask: "What's different about this factor compared to 2-3 years ago? What will be different 2-3 years from now?"
Quantify Where Possible#
| Vague | Quantified |
|---|---|
| Growing aging population | Over-65 population increasing from 17% to 22% by 2030 |
| Rising interest rates | Fed funds rate increased 500bps in 18 months |
| Increasing data privacy regulation | GDPR fines averaging $50M per major violation |
Numbers make factors concrete and enable scenario planning.
Link to Business Impact#
Every factor should connect to a business implication. A PESTLE analysis that catalogs external trends without explaining what they mean for the company has limited value.
Structure implications as: "[Factor] will [impact] resulting in [business consequence]."
Consider Interdependencies#
PESTLE factors often interact. Economic recession (E) might trigger political change (P). New technology (T) might enable regulatory change (L). Environmental pressure (E) might shift social attitudes (S).
Map these connections. They often reveal non-obvious strategic risks.
Common PESTLE Mistakes#
Mistake 1: Boiling the Ocean#
Problem: Listing 50+ factors without prioritization
Fix: Ruthlessly prioritize. Focus on 8-12 factors with highest impact and likelihood. Everything else is appendix material.
We've seen teams spend weeks cataloging every conceivable external factor, then struggle to translate the list into strategy. More factors don't equal better analysis.
Mistake 2: Ignoring Specificity#
Problem: "Changing exchange rates" as an economic factor
Fix: Specify direction, magnitude, and implication: "USD strength against EUR (up 15% YoY) reducing European revenue by $12M when translated"
As Oxford Learning Lab notes, vague PESTLE factors are "timeless and useless."
Mistake 3: One-Time Exercise Mentality#
Problem: Conducting PESTLE once during planning season, then ignoring it
Fix: Establish quarterly reviews and trigger-based updates. External environments change continuously.
Mistake 4: Siloed Analysis#
Problem: PESTLE analysis disconnected from strategy development
Fix: Integrate PESTLE findings into strategic planning, SWOT analysis, and decision frameworks. PESTLE is input to strategy, not a standalone deliverable.
Mistake 5: Domestic Bias#
Problem: Applying home-market assumptions to new geographies
Fix: Conduct separate PESTLE analysis for each significant market. What matters in the US may not matter in Brazil, and vice versa.
This was exactly the mistake that nearly derailed our pharmaceutical client's Brazil launch. They'd analyzed US regulatory factors thoroughly but assumed similar dynamics in Latin America.
Mistake 6: Opinion Without Evidence#
Problem: Stating PESTLE factors without supporting data
Fix: Every factor needs a source. If you can't cite evidence, the factor is speculation, not analysis.
PESTLE Template Formats#
PESTLE analysis can be presented in multiple formats. The right choice depends on your audience and purpose.
Table Format#
The most common format. Works well for comprehensive documentation.
| Factor | Category | Current State | Trend | Impact | Implication |
|---|---|---|---|---|---|
| EV tax credits | Political | $7,500 federal credit | Stable | High | Supports demand; monitor policy changes post-election |
| Interest rates | Economic | 5.5% Fed funds rate | Declining | High | Lower financing costs will increase purchase consideration |
| Remote work adoption | Social | 35% hybrid workforce | Stabilizing | Medium | Reduced commuting demand may affect small vehicle sales |
| Battery technology | Technological | 400-mile range standard | Improving | High | Extend product cycle; reduce range anxiety barrier |
| EPA emissions standards | Legal | 2027 standards finalized | Tightening | High | Accelerates EV transition timeline |
| Climate commitments | Environmental | Net-zero by 2050 | Strengthening | High | Long-term tailwind for electrification |
When to use: Detailed documentation, appendix material, internal working documents.
Visual Matrix Format#
A 2x2 matrix plotting impact against likelihood or timing.
This format quickly communicates which factors deserve strategic attention. High-impact, high-likelihood factors go in the "Act Now" quadrant. High-impact, low-likelihood factors go in "Monitor."
When to use: Executive presentations, strategy workshops, prioritization discussions.
Icon-Based Dashboard#
Each PESTLE factor gets a visual icon with a summary metric or trend indicator.
When to use: Executive summaries, dashboard reporting, recurring updates.
For icon-based formats, having a consistent icon library ensures visual coherence. Using the same icon set across all PESTLE presentations builds recognition.
Radar/Spider Chart#
A radar chart showing relative strength or importance of each PESTLE dimension.
When to use: Comparing multiple markets, showing relative factor importance, visual summary.
Creating PESTLE in PowerPoint#
Professional PESTLE slides follow consulting slide standards: clear action titles, one message per slide, and consistent formatting.
Slide Structure Options#
Option 1: Overview Slide + Detail Slides
- Slide 1: PESTLE summary with all six factors (high-level)
- Slides 2-7: One slide per factor with detailed analysis
This structure works for comprehensive strategic reviews where stakeholders need full context.
Option 2: Priority Factors Only
- Slide 1: "Three external factors will most significantly impact market entry"
- Slides 2-4: One slide per priority factor
This structure works for executive audiences who need decisions, not documentation.
Option 3: Comparison Format
- Slide 1: Side-by-side PESTLE comparison of two markets
- Slides 2-3: Key differences and implications
This structure works for market entry decisions between multiple options.
Formatting Best Practices#
Action Titles:
Each PESTLE slide needs an action title stating the insight, not just the topic.
| Topic Title (Wrong) | Action Title (Right) |
|---|---|
| Political Environment | Regulatory support for EVs remains strong through 2028 |
| Economic Factors | Rising rates will slow consumer financing by 15-20% |
| Technology Trends | Battery improvements will eliminate range anxiety by 2026 |
Visual Consistency:
- Use consistent icons for each PESTLE factor across all slides
- Maintain consistent color coding (e.g., Political always blue, Economic always green)
- Align all elements to a grid
Tools like Deckary can accelerate PESTLE slide creation with pre-formatted tables, consistent icons, and alignment shortcuts. When you're building multiple PESTLE analyses, having templates saves significant formatting time.
Table Formatting:
When presenting PESTLE in table format:
- Left-align text columns, center-align category columns
- Use subtle row shading for readability
- Bold key findings or factors requiring action
- Include source references in footer
Icon Selection by Factor#
Consistent iconography reinforces recognition:
| Factor | Suggested Icons |
|---|---|
| Political | Capitol building, gavel, flag, government building |
| Economic | Chart trending up/down, currency symbol, percentage, coins |
| Social | People, demographics chart, family, community |
| Technological | Gear, computer chip, innovation/lightbulb, mobile device |
| Legal | Scales of justice, document/contract, compliance checkmark |
| Environmental | Leaf, globe, recycling symbol, sustainability |
Having access to a comprehensive icon library allows you to maintain visual consistency across PESTLE presentations. Deckary includes 600+ business icons that can be recolored to match your firm's palette.
Real-World PESTLE Examples#
Let's apply PESTLE to specific industries to demonstrate practical application.
Example 1: Electric Vehicle Market Entry (US)#
| Factor | Key Finding | Strategic Implication |
|---|---|---|
| Political | Inflation Reduction Act provides $7,500 tax credit for domestic EVs | Price competitively accounting for credit; localize manufacturing |
| Economic | High interest rates reducing auto financing; price reductions of 15-25% across competitors | Prepare for margin pressure; focus on leasing alternatives |
| Social | 52% of consumers now consider EVs for next purchase (up from 38% in 2021) | Mass market transition underway; expand beyond early adopter messaging |
| Technological | Battery costs declining 8% annually; 400-mile range now standard | Product refresh cycle critical; monitor solid-state battery timeline |
| Legal | EPA emissions standards tightening through 2027; California leading state requirements | Compliance timeline clear; prepare for stricter state-level regulations |
| Environmental | Corporate fleet electrification commitments creating B2B demand | Develop fleet/commercial segment strategy alongside consumer |
Strategic conclusion: Market entry timing is favorable. Government support, consumer acceptance, and technology maturity align for growth. Key risks are price competition and interest rate environment.
Example 2: Pharmaceutical Market Entry (Brazil)#
| Factor | Key Finding | Strategic Implication |
|---|---|---|
| Political | ANVISA (regulatory agency) under budget pressure; approval timelines lengthening | Build 6-12 month buffer into launch timelines |
| Economic | Currency volatility (BRL/USD swings of 20%+); price controls on essential medications | Hedge currency exposure; segment between controlled and free-priced products |
| Social | Private healthcare growing but 75% reliant on public system SUS | Dual strategy for private and public reimbursement pathways |
| Technological | Digital health adoption accelerating; telemedicine normalized post-COVID | Digital-first patient engagement; remote monitoring capabilities |
| Legal | Patent enforcement improving but generics dominate 65% of market | Life-cycle management critical; plan for generic entry |
| Environmental | Growing ESG requirements in healthcare supply chain | Sustainability credentialing for hospital system contracts |
Strategic conclusion: Market attractive but execution-complex. Regulatory patience, currency hedging, and dual public/private strategy required for success.
Example 3: SaaS Expansion (European Union)#
| Factor | Key Finding | Strategic Implication |
|---|---|---|
| Political | Digital Markets Act (DMA) increasing scrutiny on large platforms | Monitor threshold triggers; maintain compliance documentation |
| Economic | Enterprise software spending growing 8-10% despite economic uncertainty | B2B demand remains strong; enterprises prioritizing digital transformation |
| Social | Workforce expects hybrid/remote work tools; 4-day workweek experiments spreading | Productivity positioning resonates; collaboration features priority |
| Technological | AI integration now expected in enterprise software; security requirements increasing | Accelerate AI roadmap; obtain security certifications (ISO 27001, SOC 2) |
| Legal | GDPR enforcement intensifying ($2.5B+ in fines); data localization pressure | EU data residency option required; privacy-by-design mandatory |
| Environmental | Scope 3 emissions reporting requirements coming for large enterprises | Carbon footprint transparency for enterprise sales |
Strategic conclusion: EU expansion viable with compliance investment. GDPR and data localization non-negotiable. AI differentiation and security certifications enable enterprise sales.
PESTLE vs SWOT: When to Use Each#
PESTLE and SWOT are complementary frameworks, not alternatives. Understanding when to use each—and how to combine them—improves strategic analysis quality.
Key Differences#
| Dimension | PESTLE | SWOT |
|---|---|---|
| Scope | External macro-environment only | Both internal and external factors |
| Focus | Industry-wide or market-wide forces | Company-specific assessment |
| Control | Factors largely outside company control | Includes factors company can influence |
| Depth | Deep dive on external context | Broader but shallower coverage |
| Typical output | Environmental scan, trend analysis | Strategic positioning, action planning |
| Time orientation | Current state and future trends | Current capabilities and opportunities |
When to Use PESTLE#
- Entering new markets or geographies
- Scanning for industry disruption signals
- Annual strategic planning macro-context
- Major investment or M&A due diligence
- Understanding regulatory landscape changes
When to Use SWOT#
- Competitive positioning analysis
- Product or service strategy
- Organizational capability assessment
- Strategic initiative prioritization
- Quick strategic snapshot
Using Both Together#
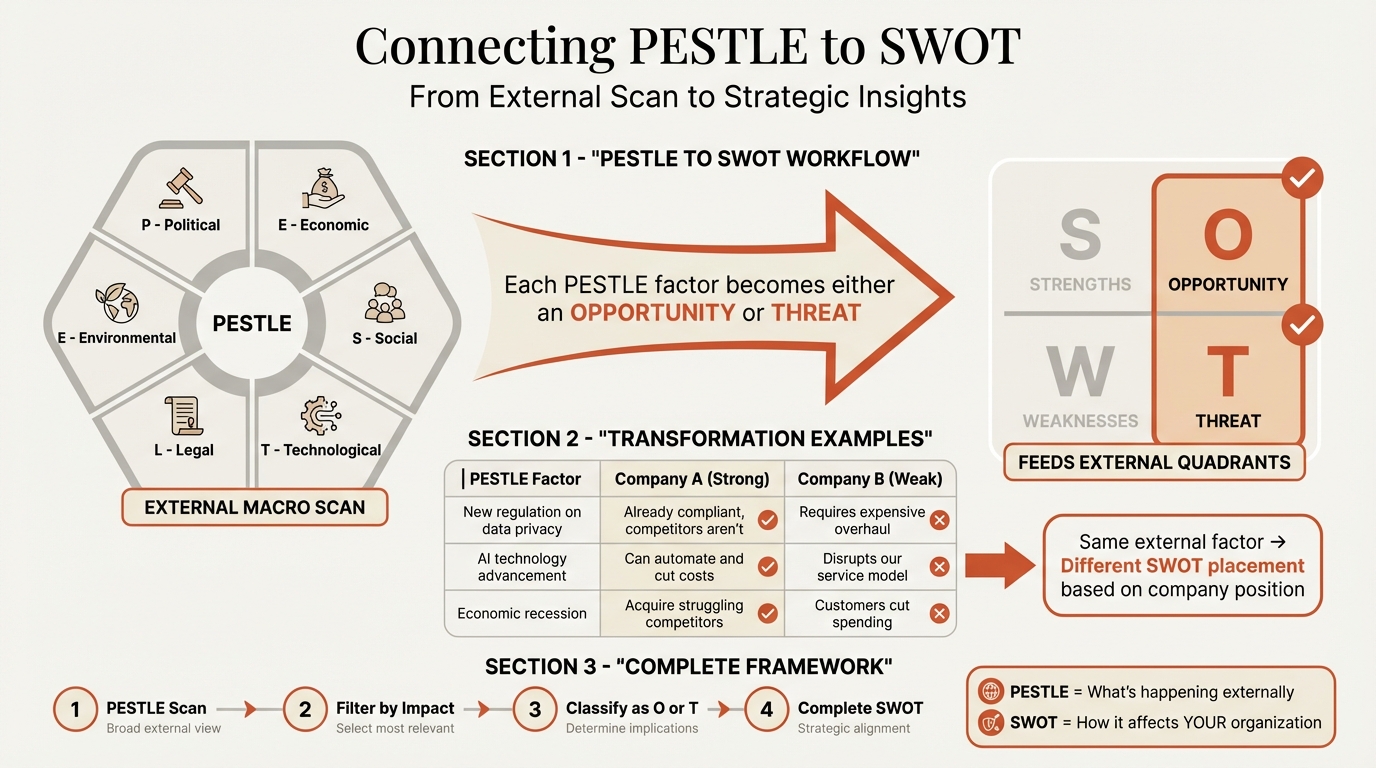
The most robust approach uses PESTLE and SWOT together:
- Start with PESTLE: Scan the macro-environment to understand external context
- Feed PESTLE into SWOT: PESTLE findings populate the Opportunities and Threats quadrants
- Add internal analysis: Complete SWOT with Strengths and Weaknesses
- Develop strategy: Use complete SWOT for strategic option generation
This layered approach ensures external context isn't overlooked while still generating company-specific strategic options.
Integration Example#
PESTLE Finding: "Regulatory changes will require carbon emission reporting for all suppliers to large enterprises by 2027"
SWOT Translation:
| If your company... | Then it's a... |
|---|---|
| Has strong sustainability credentials | Opportunity: Competitive advantage with enterprise customers |
| Lacks carbon measurement capabilities | Threat: Risk of enterprise customer loss |
| Has invested in sustainability reporting | Strength: Ready for regulatory requirements |
| Has high carbon intensity | Weakness: Competitive disadvantage and compliance cost |
The same PESTLE factor becomes different SWOT elements depending on company position.
Summary#
PESTLE analysis is an essential strategic tool for understanding the macro-environment. When used correctly, it surfaces external factors that create opportunities or threats before they impact the business.
Key principles:
- Six comprehensive dimensions: Political, Economic, Social, Technological, Legal, Environmental
- Prioritize ruthlessly: Focus on 8-12 factors with highest impact and likelihood
- Be specific: Quantify factors and state implications, not just observations
- Update regularly: External environments change; analysis should too
- Integrate with other tools: PESTLE feeds SWOT, Porter's Five Forces, and strategic planning
When to use PESTLE:
- Market entry and geographic expansion
- Strategic planning and annual reviews
- M&A due diligence and investment decisions
- Risk assessment and scenario planning
- Industry disruption scanning
For PowerPoint presentations:
- Use action titles stating insights, not just topics
- Choose format (table, matrix, dashboard) based on audience
- Maintain consistent iconography across factors
- Apply consulting slide standards for professional output
The Brazil pharmaceutical launch that opened this article eventually succeeded—six months behind schedule, but successful. The PESTLE analysis we conducted identified three additional risks that required mitigation. More importantly, it became the template for preventing similar surprises on future market entries.
That's the value of PESTLE: not just documenting what you know, but systematically identifying what you might have missed.
Build consulting slides in seconds
Describe what you need. AI generates structured, polished slides — charts and visuals included.
Try Free