Quarterly business review PowerPoint template
A complete seven-slide QBR deck with a quarterly scorecard, revenue chart, customer outcomes, risks and decisions. Download the filled example or start with the blank version.
Free downloads. No signup required. Native PowerPoint text, tables and chart data remain editable. All example data is fictional.
Read the format and writing guide
What you get
- Seven slides in each PPTX, including the cover
- Filled Q3 example for a fictional software company
- Blank version with labelled fields and editable chart data
- KPI comparison, revenue drivers and customer outcomes
- Next-quarter priorities with owners and approval dates
How to use the PPTX
- Download the filled example to see how metrics support a quarterly narrative, or choose the blank PPTX.
- Open the file in PowerPoint and replace the company, reporting period and bracketed fields.
- Edit tables directly. For the revenue chart, use Edit Data to replace monthly categories and values.
- Recalculate the quarter total, target variance and growth rate from your own source data.
- Update risk owners and next-quarter decisions, then remove illustrative notes before presenting.
Inside the filled example
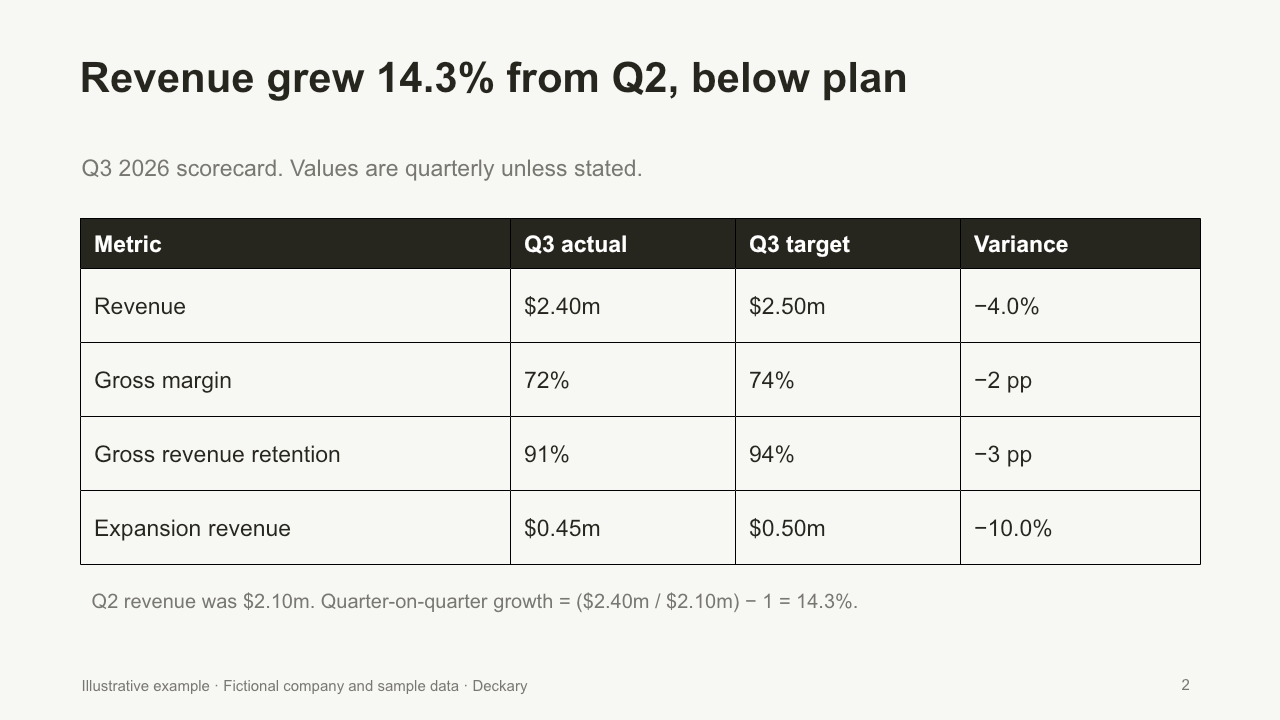
Quarterly scorecard
The filled example compares $2.40m in revenue with a $2.50m target and keeps percentage-point changes separate from relative changes.
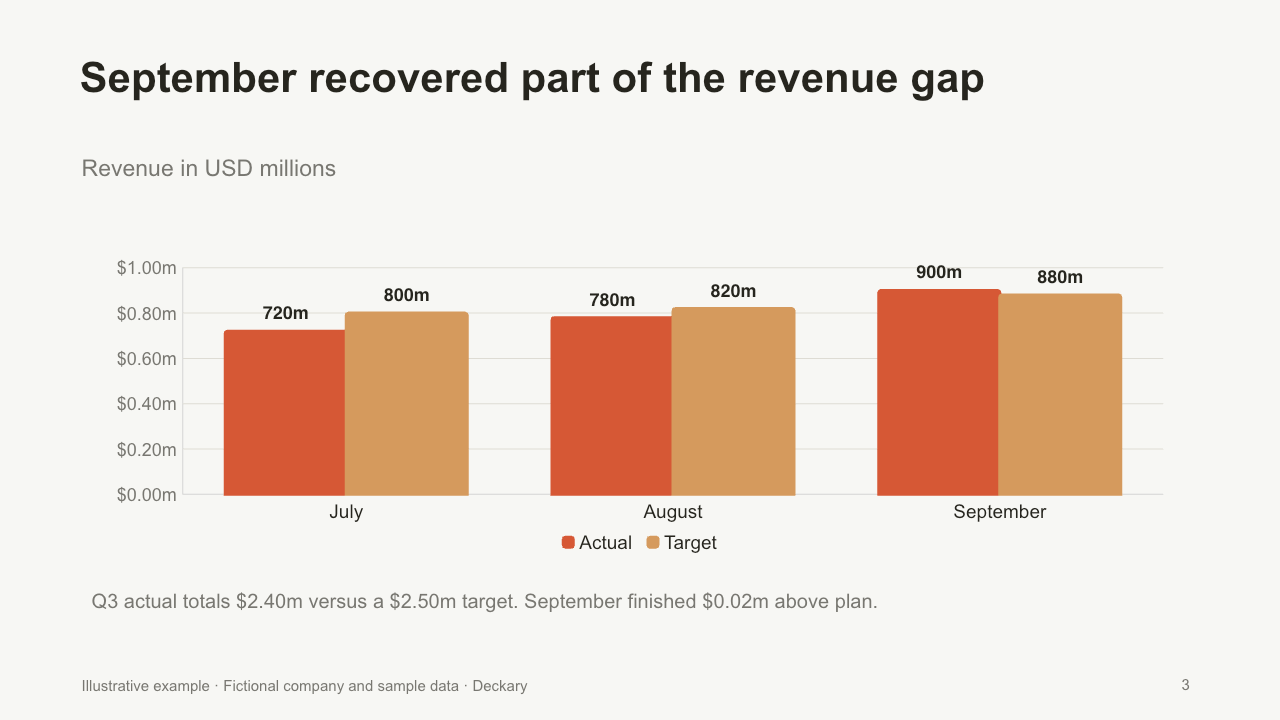
Editable revenue chart
The native PowerPoint column chart contains July, August and September data. All series and labels remain editable.
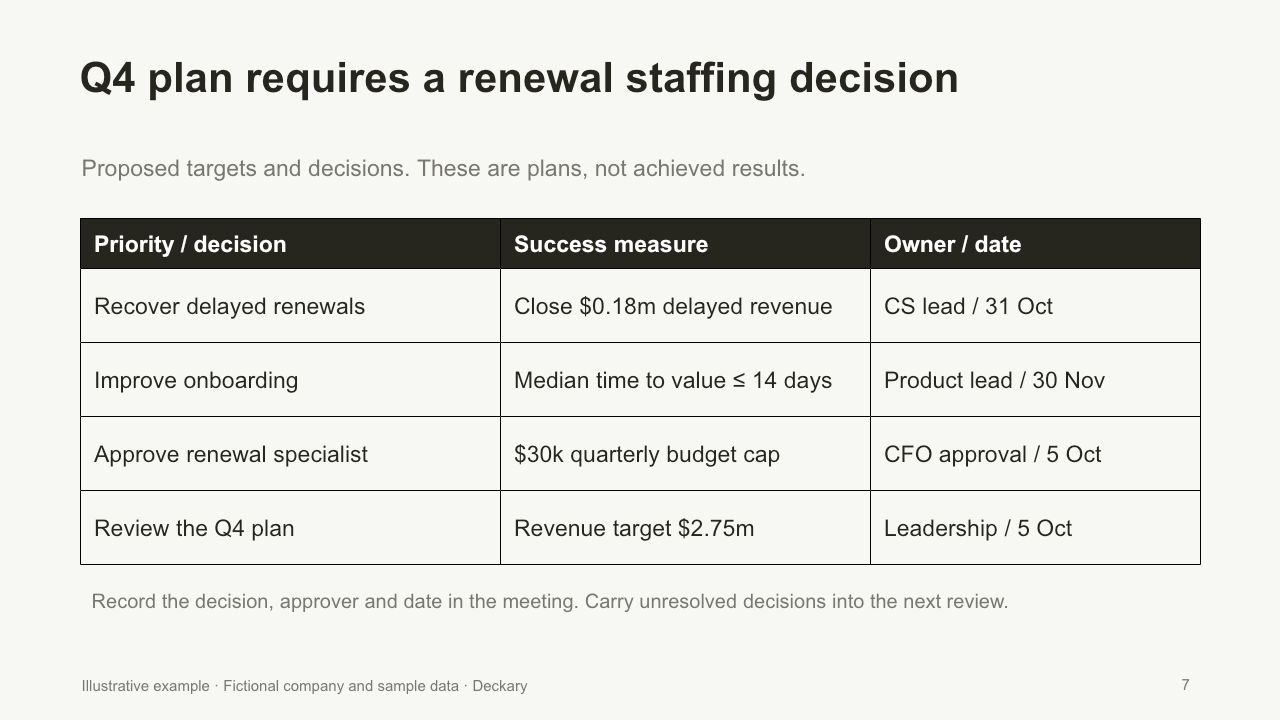
Next-quarter decisions
The final slide connects renewal recovery to dated actions and a specific staffing approval.
A filled QBR example, ready to adapt
The example follows fictional company Northstar Analytics through Q3 2026. Revenue rises from $2.10m in Q2 to $2.40m in Q3, an increase of 14.3%, while remaining 4.0% below the $2.50m quarterly target. The deck explains both comparisons rather than treating growth as evidence that the plan succeeded.
The revenue bridge identifies a $0.18m renewal shortfall, offset by $0.05m of additional expansion revenue and $0.03m of usage revenue. Those movements total the $0.10m gap. The final slide assigns the renewal recovery to an owner and asks for a specific staffing decision.
All figures and company details are illustrative. Replace them with your own approved information. The download contains native PowerPoint text, tables and a chart, rather than slide screenshots.
PowerPoint download or a new AI report
The two download buttons give you these exact PPTX files. The blank version keeps the slide structure and editable chart, with zero-valued chart placeholders and labelled fields to complete. The separate AI action starts Deckary’s browser presentation workflow, where you can describe a new QBR using your own material.
For agenda design, facilitation and metric selection, read the quarterly business review guide. For a shorter delivery update, use the progress report PowerPoint template. For a governance meeting, use the board report PowerPoint template.
Create a report from your own material
Start a new presentation in Deckary's browser editor with your own brief and source files. This creates a new AI report; it does not load the exact downloadable deck. See trial limits and plans.
Create a new report with AIQuarterly Business Review PowerPoint Template FAQs
Complete guide
Related articles
Related features