Progress report PowerPoint template
A seven-slide project update covering status, milestones, spend, forecast cost, blockers and decisions. Download a filled customer-portal example or the matching blank PPTX.
Free downloads. No signup required. Native PowerPoint text, tables and chart data remain editable. All example data is fictional.
Read the format and writing guide
What you get
- Seven-slide filled project update and matching blank PPTX
- Status summary that distinguishes schedule, scope and budget
- Milestone table with baseline and forecast dates
- Native editable cumulative-spend chart
- Budget, actuals, remaining cost and final forecast table
- Blockers and decisions with named owners and due dates
How to use the PPTX
- Download the filled example to see the reporting logic, or open the blank PPTX in PowerPoint.
- Set the project name, reporting period, approved budget and baseline dates.
- Replace milestone dates and name the owner of each delivery.
- Edit the spend chart data and reconcile actual costs plus remaining estimates to forecast cost.
- State the decision needed, approver and due date. Refresh the report at the next agreed checkpoint.
Inside the filled example
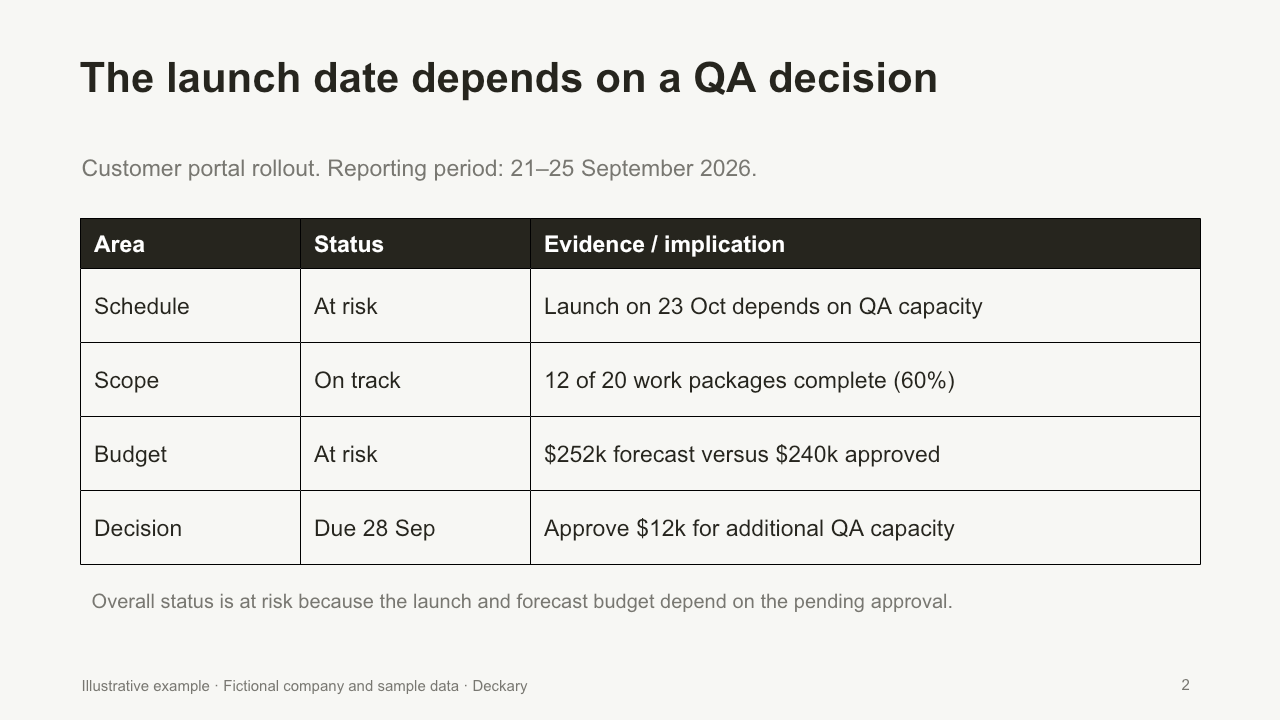
Status at a glance
The example explains why 60% work-package completion does not remove the need for a QA staffing decision.
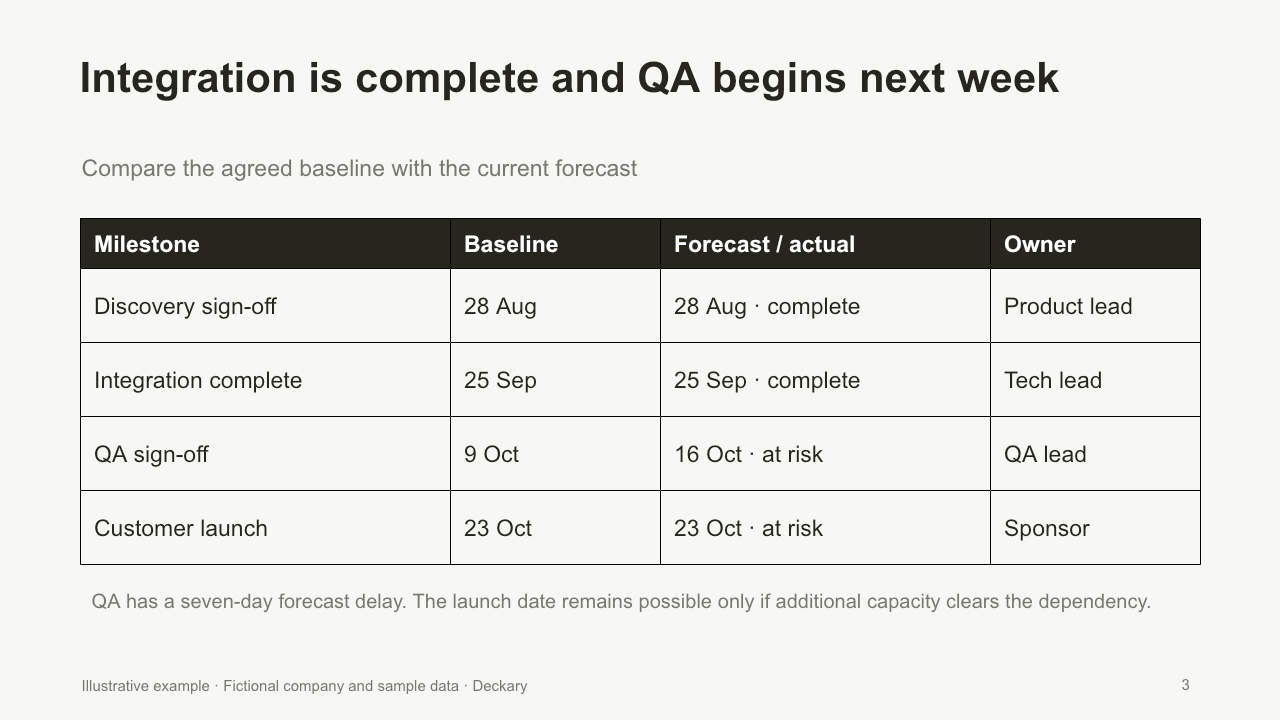
Milestone tracking
The planned QA sign-off moves by seven days. The launch date remains conditional on resolving the dependency.
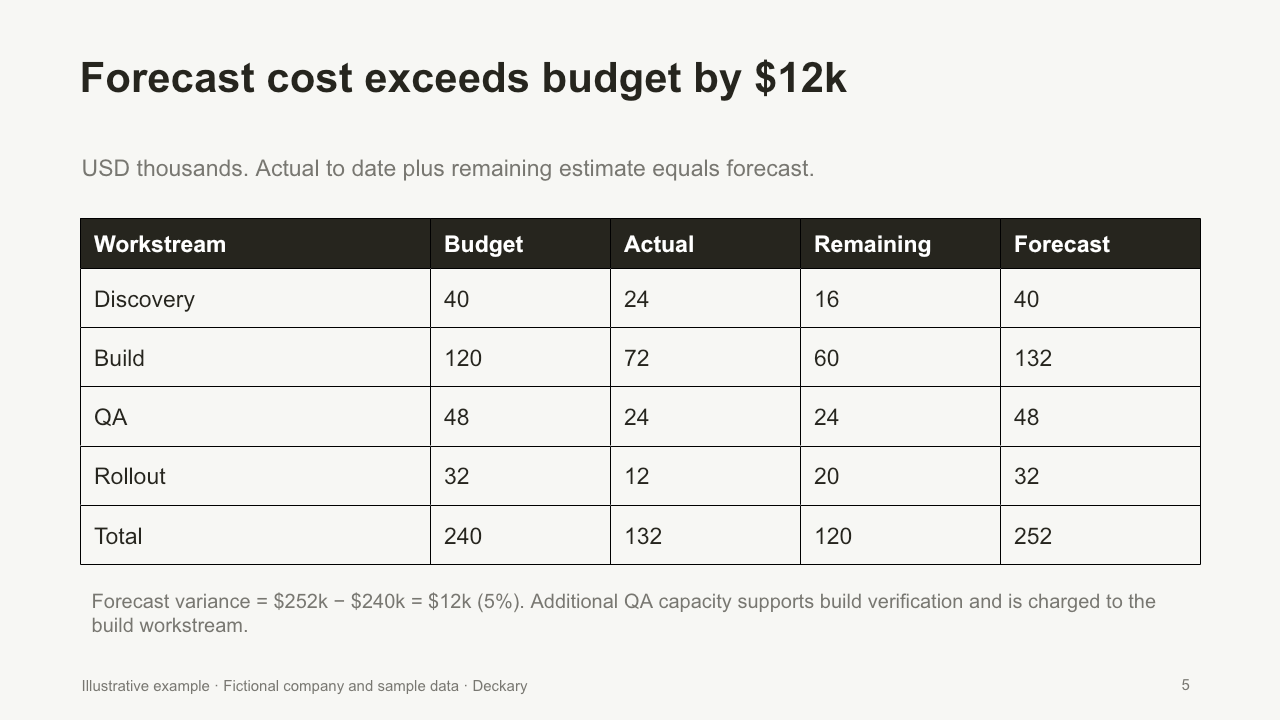
Budget reconciliation
Actual spend of $132k plus $120k remaining equals a $252k forecast, which is $12k or 5% above the approved budget.
A filled project update with a clear decision
The fictional customer portal project has completed 12 of 20 work packages at week six of a ten-week plan. Actual spend is $132k against $144k planned to date, but management still flags the project as at risk: QA capacity affects the launch and forecast cost is $252k against a $240k budget.
The example keeps completed dates, forecast dates and approvals separate. It asks the sponsor to approve a $12k increase by 28 September. If the sponsor declines, the project manager must revisit scope and launch timing. Every slide labels the sample data as illustrative.
The blank version preserves the reporting structure
The blank PPTX contains editable tables and a native chart. Bracketed fields show where your project information belongs. Chart values start at zero so you can replace them using PowerPoint’s Edit Data command. The fields are prompts to complete, not an automatically calculated project plan.
Use this deck when you need to present a project update. For a written document or an explanation of reporting sections, read the progress report format guide. For a monthly cadence, use the monthly progress report guide. Browse project management slides for additional planning layouts.
Create a report from your own material
Start a new presentation in Deckary's browser editor with your own brief and source files. This creates a new AI report; it does not load the exact downloadable deck. See trial limits and plans.
Create a new report with AIProgress Report PowerPoint Template FAQs
Complete guide
Related articles
Related features