Free Think-Cell Alternatives for Students and Freelancers (2026)
Can't afford Think-cell's $299/year price tag? Discover free and budget alternatives including native PowerPoint, Power-user's academic license, and Deckary at $49/year.
Think-cell is the industry standard for consulting charts, used by every major consulting firm and investment bank. At $299+ per year, it's also out of reach for many students, freelancers, and early-career professionals.
If you're looking for free or budget alternatives, you have several options: Think-cell's academic license (free for qualifying students), Power-user's academic tier (free with simpler application), native PowerPoint workarounds (included but time-consuming), and budget add-ins like Deckary ($49/year).
This guide covers your options honestly—what works, what doesn't, and where each alternative makes sense.
Why Think-Cell Costs What It Does#
Before exploring alternatives, it's worth understanding Think-cell's value proposition. The software isn't expensive arbitrarily.
Think-cell solves genuinely hard problems:
- Waterfall charts that automatically calculate bridges and totals
- Mekko charts (nearly impossible to build manually in PowerPoint)
- Excel linking that updates charts when source data changes
- Smart labeling that prevents overlaps and improves readability
- Automatic agenda slides that update as your deck evolves
For a McKinsey consultant billing $500/hour, Think-cell pays for itself in the first hour of saved time. At that math, $299/year is trivial.
But you're not billing $500/hour. You're a student, a freelancer building your client base, or an early-career professional. The math is different.
Let's find alternatives that fit your math.
Truly Free Options#
1. Native PowerPoint Charts#
Cost: Included with Microsoft 365 (which you likely already have)
Best for: Basic charting needs with no additional cost
PowerPoint's built-in charting has improved significantly over the past decade. If you have Microsoft 365, you already have access to:
- Bar, column, line, and pie charts
- Combo charts (mixing chart types)
- Treemaps and sunburst charts
- Scatter and bubble charts
- Stock and surface charts
- Data linking from Excel (with limitations)
What native PowerPoint does well:
For straightforward data visualization—revenue over time, market share breakdowns, simple comparisons—native PowerPoint is adequate. The interface is familiar, the output is professional enough, and the price is right.
What native PowerPoint doesn't do:
Here's where reality sets in. Native PowerPoint cannot create:
- True waterfall charts — You can fake them with stacked bar charts and invisible segments, but it takes 10-15 minutes of manual work and breaks when you update data
- Mekko (Marimekko) charts — Essentially impossible without add-ins
- Reliable Excel linking — Links exist but break frequently and don't handle complex data well
- Automatic labeling — You'll spend time manually positioning labels to prevent overlaps
Our honest assessment:
We built the same waterfall chart in native PowerPoint and Think-cell during testing. Native PowerPoint: 12 minutes using stacked bar workarounds. Think-cell: 45 seconds. For a one-off chart, 12 minutes is tolerable. For weekly deliverables, it's not sustainable.
Verdict: Use native PowerPoint for simple bar, line, and pie charts. Look elsewhere for waterfall and Mekko charts.
2. Think-Cell Academic License#
Cost: Free (with conditions)
Best for: Students and professors at qualifying institutions
Think-cell offers free licenses to students, professors, and researchers. The catch: your institution must add a link to Think-cell's website on an official institutional webpage.
How to apply:
- Visit Think-cell's academic license page
- Complete the application with your institutional email
- Coordinate with your institution to add the required link
- Receive a license key valid for 12 months
- Renew annually as long as you remain a student or professor
The reality check:
Getting the institutional link approved can be challenging. IT departments and web teams may not prioritize adding links for individual students. Some institutions have policies against this kind of arrangement.
If your institution already has the link (check if other students have Think-cell), you're in luck—just apply. If not, you're looking at a bureaucratic process that may or may not succeed.
Verdict: Worth attempting if you're at a university. Apply early—don't wait until the week before your internship starts.
3. Power-user Academic License#
Cost: Free for students and academics
Best for: Students who want Think-cell-like features without the institutional link requirement
Power-user offers a completely free academic license with a simpler application process than Think-cell. No institutional link required—just proof of student status.
What Power-user includes (free academic tier):
- 110+ chart types including waterfall charts
- 350 editable maps for geographic data
- 850+ slide templates
- 7,000+ icons
- Excel linking
- Works on Windows and Mac
How to apply:
- Visit Power-user's website
- Apply with your academic email (.edu or equivalent)
- Provide proof of enrollment if requested
- Receive free access while you remain a student
What's different from Think-cell:
Power-user is broader but less specialized. Its waterfall charts work, but the interface isn't as polished as Think-cell's. It's a Swiss Army knife versus a precision tool.
For students who need waterfall charts occasionally and value the template library and maps, Power-user's free academic license is genuinely valuable.
Verdict: The best truly free option for students who need waterfall charts.
4. Google Slides and Canva#
Cost: Free (basic tiers)
Best for: Non-consulting contexts where PowerPoint compatibility isn't required
Let's address these honestly: Google Slides and Canva are not Think-cell alternatives for consulting work. But if you're creating charts for class presentations, personal projects, or non-consulting contexts, they're worth mentioning.
Google Slides:
- Free with a Google account
- Basic chart types (bar, line, pie)
- Real-time collaboration
- No waterfall or Mekko charts
- No PowerPoint add-in functionality
Canva:
- Free tier available
- Attractive templates
- Limited charting capabilities
- Not designed for data-driven presentations
- No Excel linking
When these make sense:
If you're creating a pitch deck for a class project and aesthetics matter more than data precision, Canva produces attractive output quickly. If you're collaborating with classmates in real-time, Google Slides works well.
When these don't work:
Any professional consulting context. Client deliverables. Investment banking. Anything where someone might ask "Can you update that waterfall with last quarter's numbers?"
Verdict: Use for class projects and personal work. Don't use for consulting deliverables.
5. Excel Charts (Copied to PowerPoint)#
Cost: Included with Microsoft 365
Best for: Data-heavy presentations where Excel is your primary tool
Here's an underutilized approach: build charts in Excel and paste them into PowerPoint.
Excel's charting is more powerful than PowerPoint's native charting:
- More chart customization options
- Better data handling
- Waterfall charts (since Excel 2016) with automatic calculations
- Can maintain live links to Excel data
The workflow:
- Build your chart in Excel with all data formatting
- Copy the chart
- Paste into PowerPoint (choose "Keep Source Formatting" or "Link Data")
- Update in Excel; PowerPoint chart updates
The limitations:
- Excel's waterfall charts are functional but not as polished as Think-cell's
- Links can break when files move or are shared
- Formatting options in Excel differ from PowerPoint
- Mekko charts are still not available
Our experience:
We use this approach for quick internal presentations. For client-facing work, the formatting limitations become noticeable. Excel waterfall charts look "Excel-ish" rather than consultant-polished.
Verdict: Viable workaround for internal presentations. Not ideal for client deliverables.
Continue reading: Bullet Charts in PowerPoint · Duplicate Shortcut in PowerPoint · Deloitte Presentation Template
Build consulting slides in seconds
Describe what you need. AI generates structured, polished slides — charts and visuals included.
Budget Options (Nearly Free)#
When truly free options fall short, these budget alternatives deliver professional results without Think-cell's price tag.
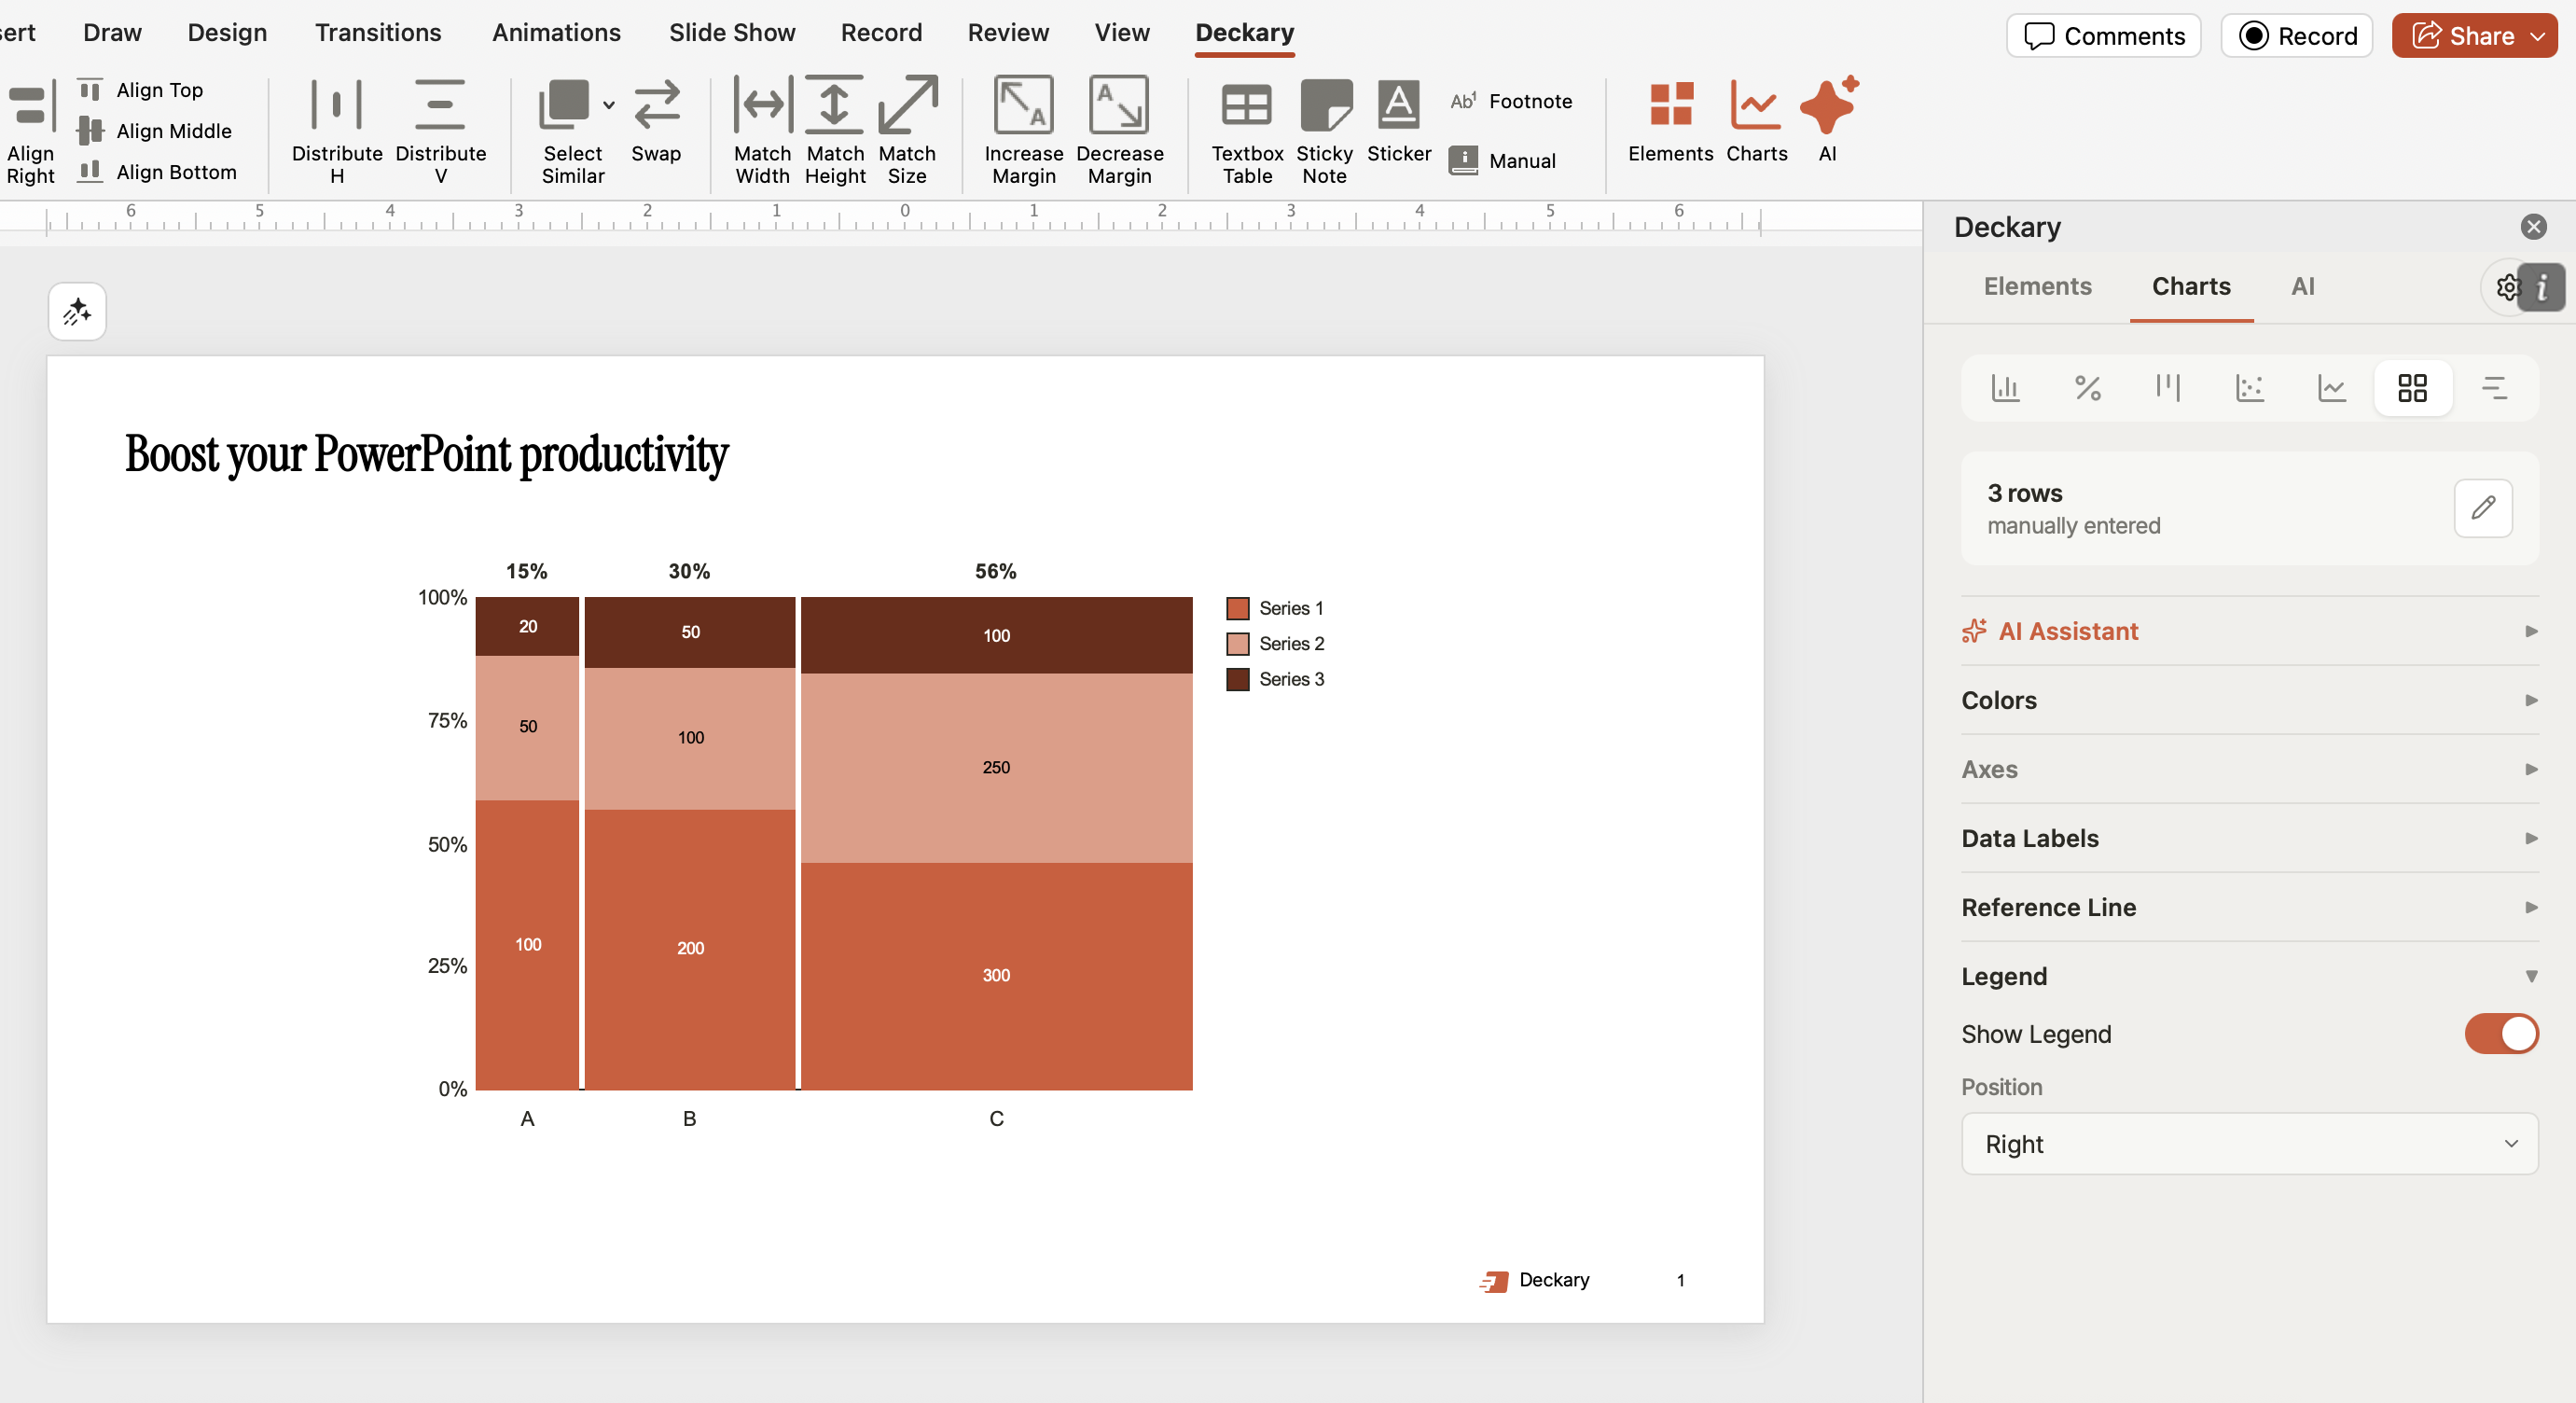
1. Deckary — $49-119/year#
Cost: $49/year (Starter), $119/year (Premium), $199 lifetime
Best for: Freelancers and budget-conscious consultants who need consulting-grade charts
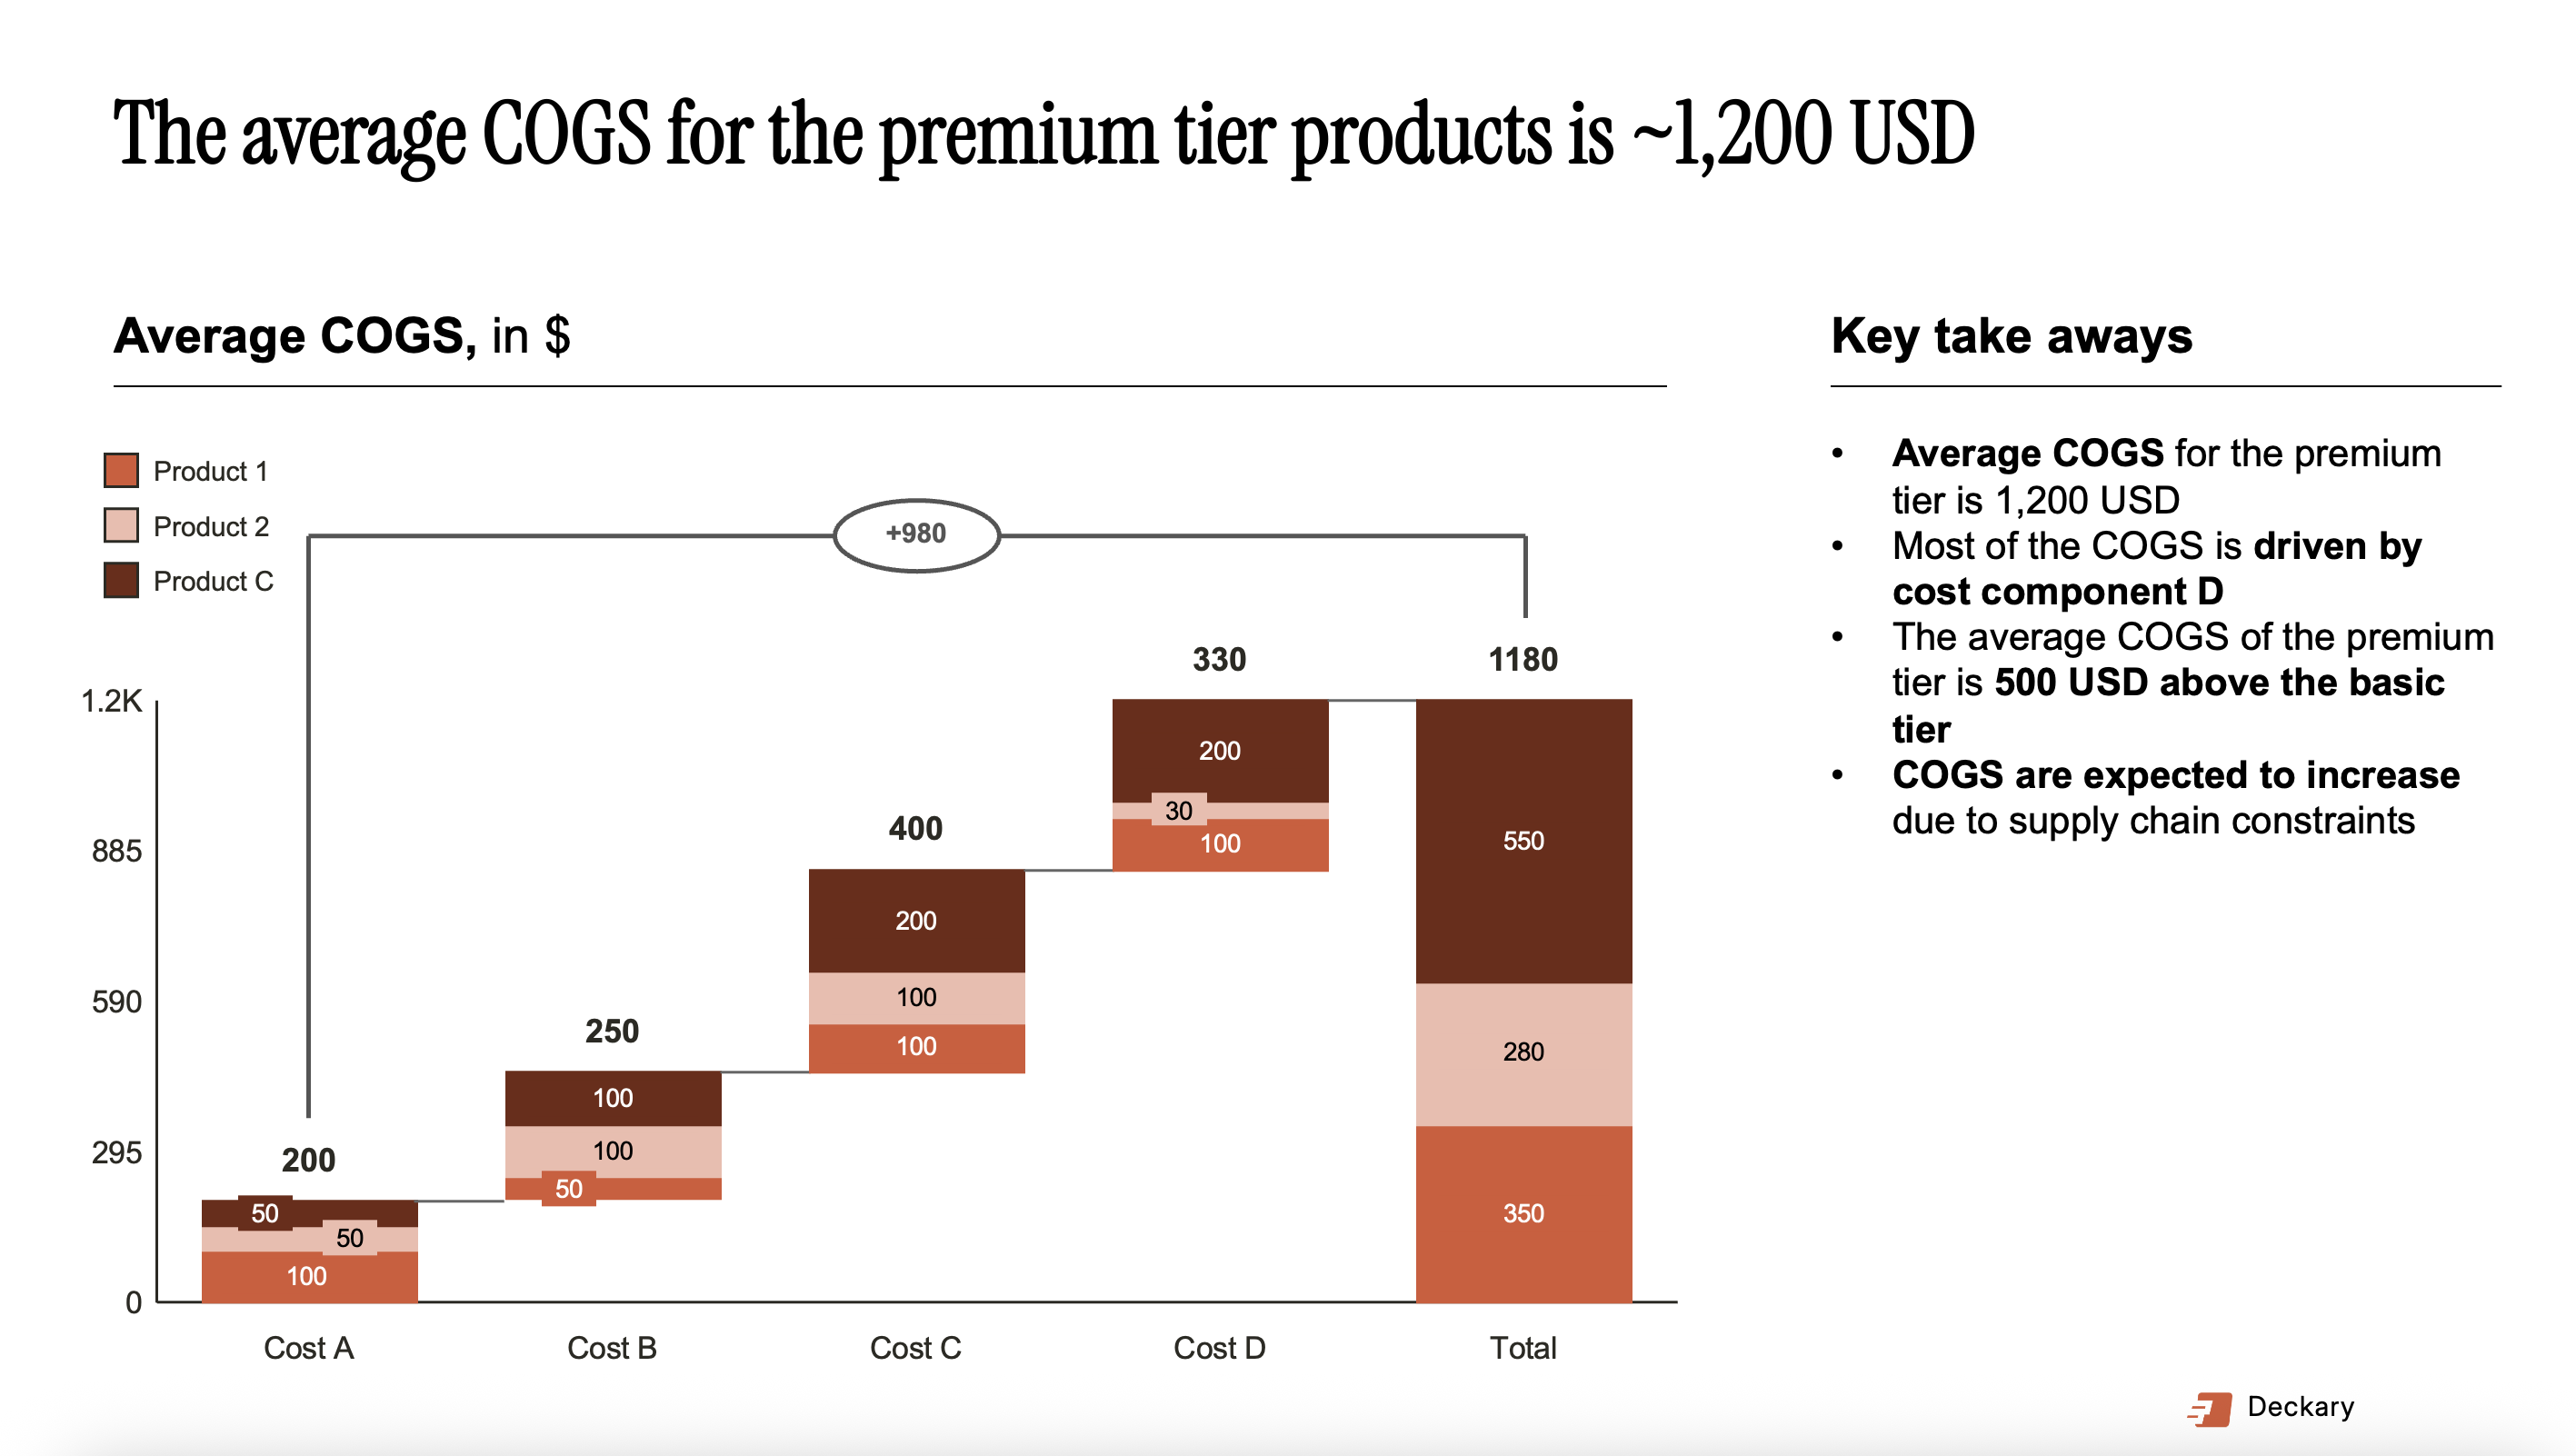
Deckary sits in a unique position: professional charting capabilities at roughly one-sixth Think-cell's price.
What you get:
- Waterfall charts with automatic bridges, totals, and subtotals
- Mekko (Marimekko) charts for market sizing
- Gantt charts for project timelines
- 100% stacked bar charts for share analysis
- Excel linking for automatic chart updates
- CAGR lines and delta indicators for financial presentations
- 600+ icon library built into PowerPoint
- Keyboard shortcuts for alignment and distribution
- Works on Windows and Mac with identical functionality
Price comparison:
| Tool | Annual Cost | Monthly Cost | Savings vs Think-cell |
|---|---|---|---|
| Think-cell | $299-327 | ~$25-27 | — |
| Deckary Starter | $49 | ~$4 | 85% |
| Deckary Premium | $119 | ~$10 | 64% |
| Deckary Lifetime | $199 (one-time) | — | Pays for itself in 8 months |
Our testing results:
We built identical waterfall charts in Think-cell and Deckary. Output quality was indistinguishable. The workflow differs slightly, but the end result—a professional waterfall chart linked to Excel data—is equivalent.
Where Deckary differs:
- Fewer total chart types — Deckary focuses on core consulting charts rather than 40+ variations
- No automatic agenda slides — Think-cell's agenda feature isn't replicated
- Includes productivity tools — Shortcuts and icons that Think-cell doesn't offer
Who this makes sense for:
Freelance consultants billing clients $100-200/hour who need professional charts weekly or monthly rather than daily. At $49/year, Deckary pays for itself if it saves you two hours over twelve months—essentially one waterfall chart.
Students who will enter consulting and want to learn professional charting tools without Think-cell's price tag.
Small teams where $299/user/year for Think-cell isn't in the budget.
Verdict: The best value option for consulting-grade charts. Try the 14-day free trial to compare against Think-cell directly.
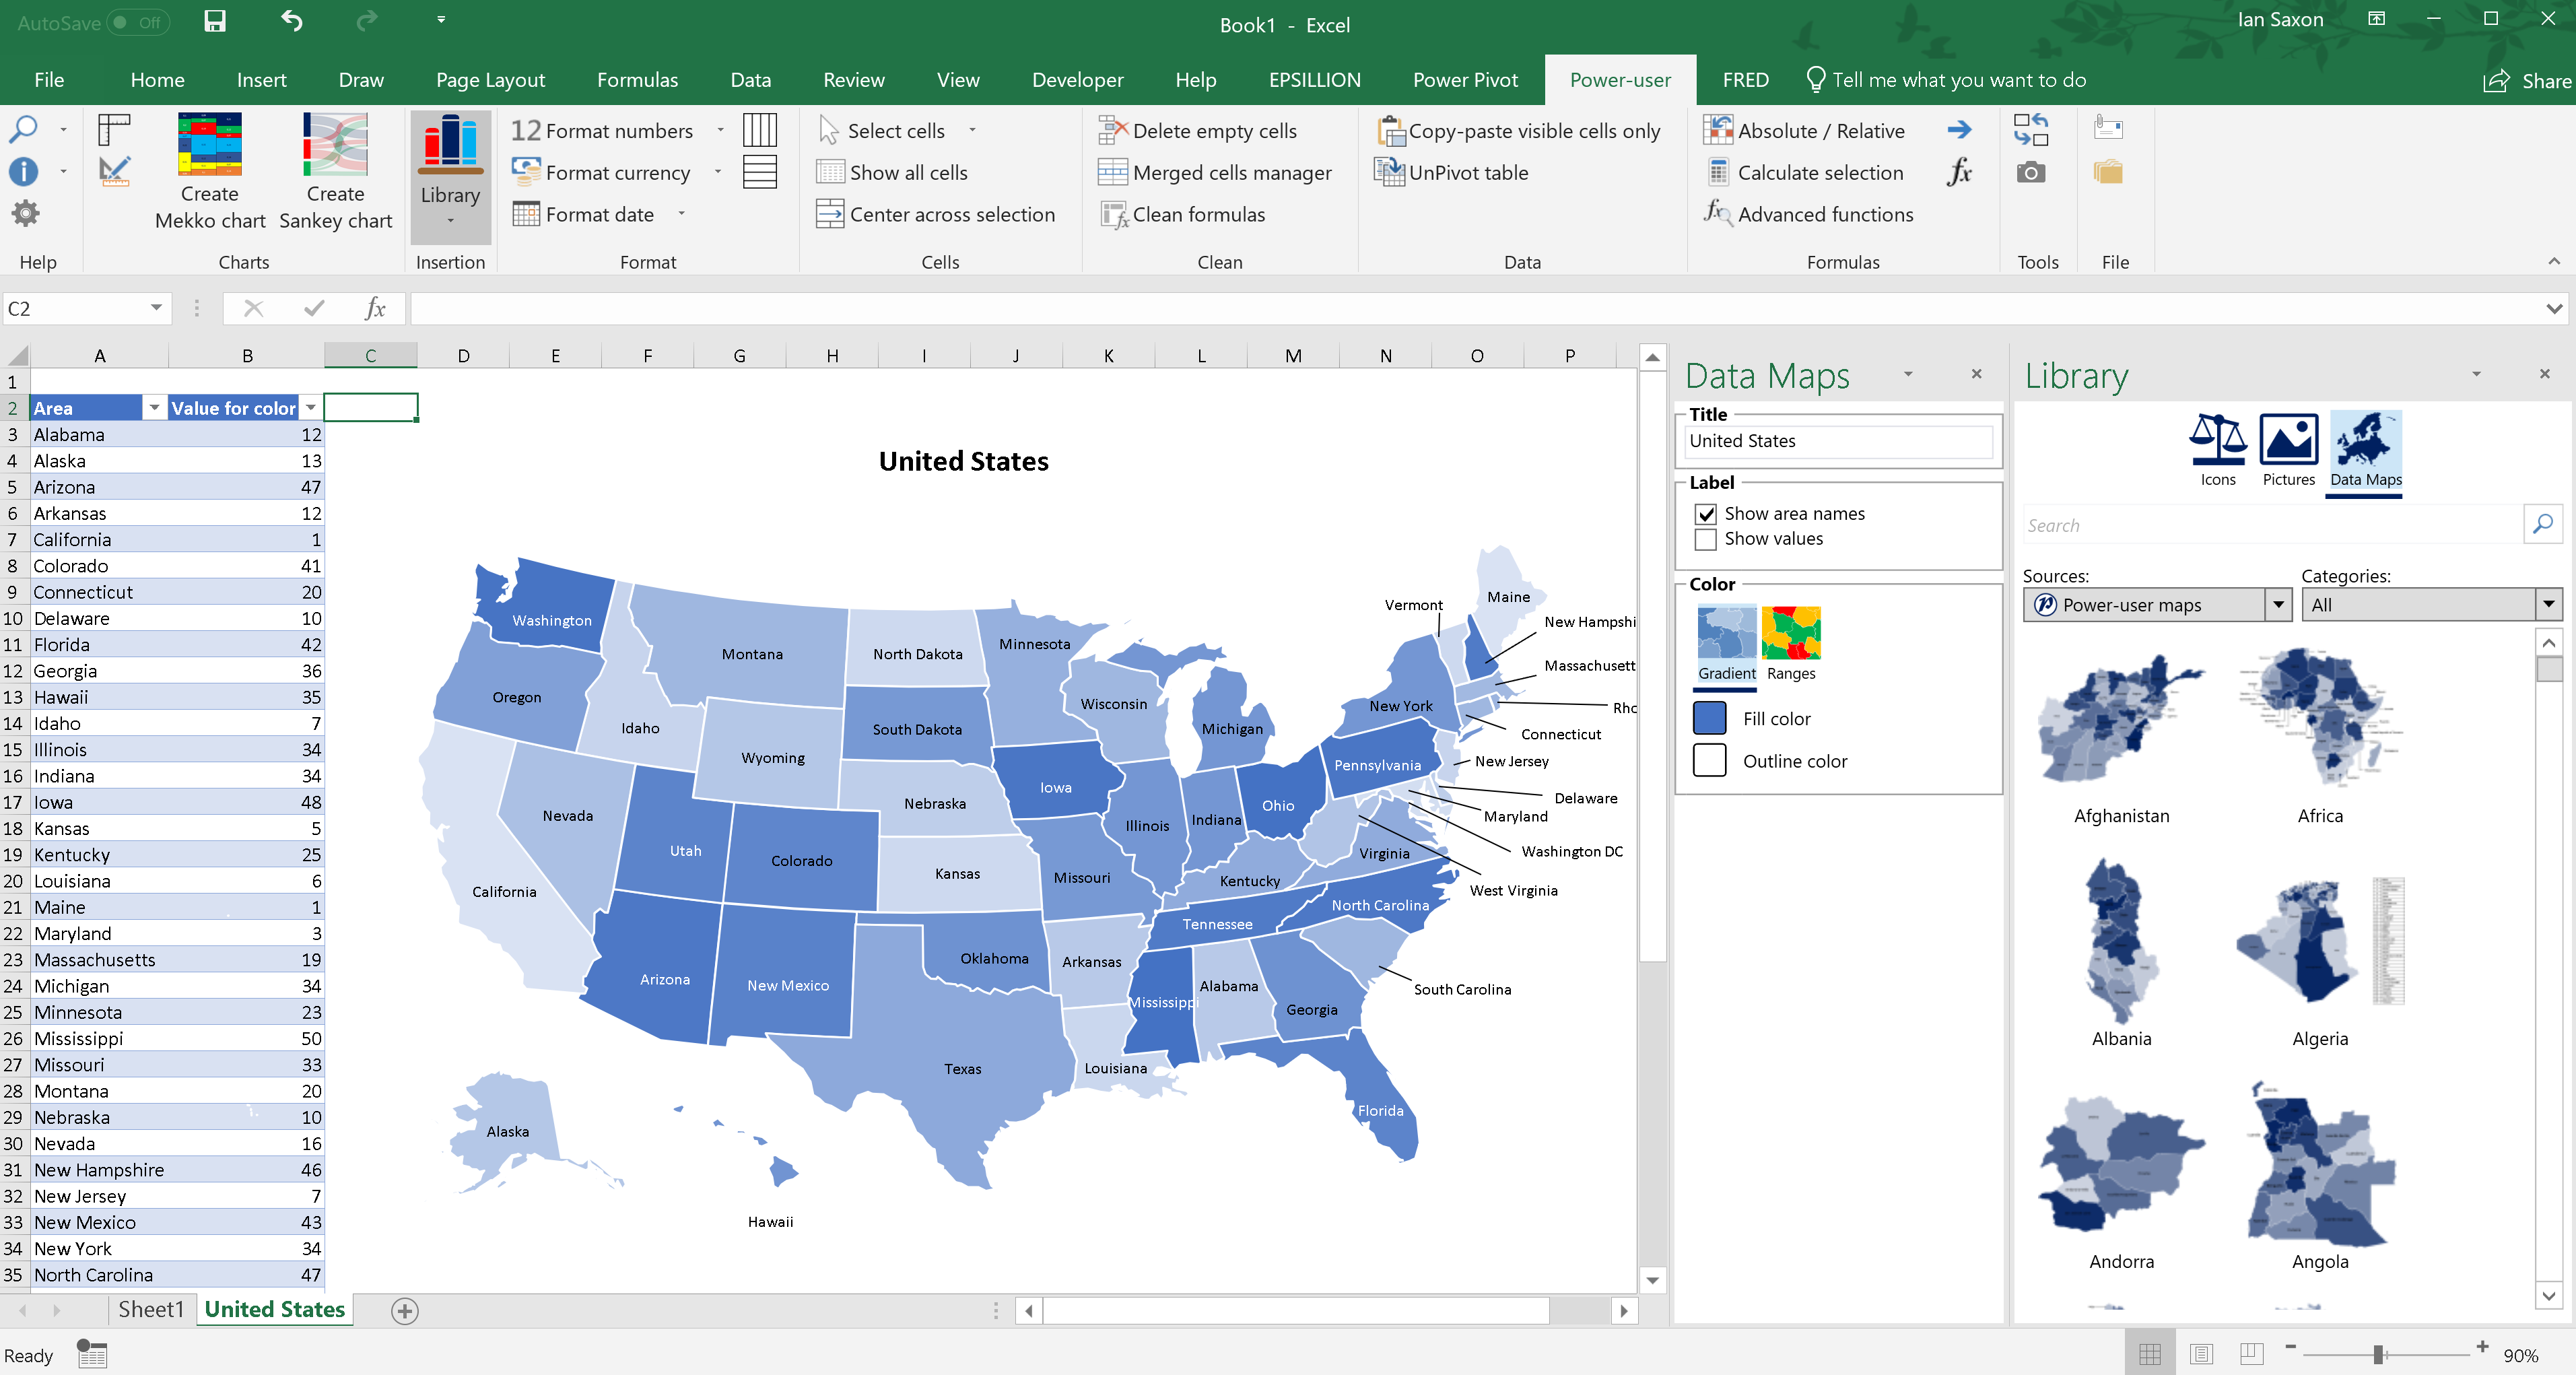
2. Power-user — $105/year (or free for academics)#
Cost: $105/year standard; free for students and academics
Best for: Users who need charts AND maps AND templates in one package
Power-user takes a different approach than Think-cell or Deckary. Rather than specializing in charts, it bundles multiple PowerPoint enhancement features:
- 110+ chart types (including waterfall)
- 350 editable maps
- 850+ slide templates
- 7,000+ icons
- Diagram and process builders
- Excel integration
The trade-off:
Power-user is broader but shallower. Its waterfall charts work, but they're not as refined as Think-cell's or Deckary's. If you specifically need polished financial charts, dedicated tools perform better.
When Power-user shines:
If you frequently need geographic data visualization—market presence by country, regional sales comparisons—Power-user's map library is valuable. The template collection is genuinely useful for building decks quickly.
Verdict: Good if you need the full toolkit. If you specifically need waterfall and Mekko charts, Deckary offers more polish for less money.
Comparison: Free vs Budget vs Premium#
Here's how your options stack up:
| Feature | Native PPT | Power-user Free | Deckary $49 | Think-cell $299 |
|---|---|---|---|---|
| Price | $0 | $0 (academic) | $49/year | $299/year |
| Waterfall Charts | Manual (10-15 min) | Yes | Yes (45 sec) | Yes (45 sec) |
| Mekko Charts | No | Yes | Yes | Yes |
| Excel Linking | Fragile | Yes | Yes | Yes |
| Auto Labeling | No | Limited | Yes | Yes |
| Gantt Charts | No | Yes | Yes | Yes |
| Windows | Yes | Yes | Yes | Yes |
| Mac | Yes | Yes | Yes | Yes |
| Icons Included | No | 7,000+ | 600+ | No |
| Learning Curve | Low | Medium | Low | Medium |
| Best For | Basic charts | Students | Budget pros | Enterprise |
Decision Framework: Which Option Is Right for You?#
You're a Student Preparing for Consulting#
Recommended path:
- First choice: Apply for Think-cell's academic license if your institution can add the required link
- Backup: Apply for Power-user's free academic license (simpler process)
- If both fail: Use native PowerPoint for now; learn the workarounds
You'll eventually have access to Think-cell at your firm. The goal is getting through interviews and internships without spending money you don't have.
You're a Freelance Consultant Building Your Practice#
Recommended path:
- Start with Deckary's free trial — 14 days to test with real client work
- If you need waterfall/Mekko charts regularly: Subscribe at $49-119/year
- When you're billing $150+/hour consistently: Consider upgrading to Think-cell
At $49/year, Deckary costs less than one hour of your billable time. If it saves you two hours over a year—one waterfall chart, one Mekko chart—it's paid for itself.
You're an Early-Career Professional at a Firm Without Think-Cell#
Recommended path:
- Check if your firm has any charting tools already — IT may have licenses you don't know about
- If paying out-of-pocket: Deckary at $49/year is the most practical option
- Make the business case: Show your manager the productivity math; $299/user for Think-cell or $49/user for Deckary might become a team expense
Don't suffer with manual PowerPoint charts because your firm hasn't invested in tools. The budget options exist specifically for situations like yours.
You're a Graduate Student with Research Presentations#
Recommended path:
- Apply for Power-user's free academic license — The map library is valuable for research presentations
- Use Excel's waterfall charts for data visualization in papers and presentations
- Skip Think-cell entirely — You likely don't need consulting-specific features
Research presentations have different requirements than client deliverables. The free options are usually sufficient.
Honest Limitations of Free Options#
Free alternatives exist, but they involve trade-offs. Here's what you're giving up:
Time#
Native PowerPoint waterfall charts take 10-15 minutes versus 45 seconds in dedicated tools. If you build one waterfall chart per week, that's 10+ hours per year of unnecessary work. Your time has value.
Quality#
Free tools produce functional charts. Premium tools produce polished charts. The difference:
- Automatic labeling that prevents overlaps
- Consistent spacing and alignment
- Professional formatting defaults
- Reliable Excel linking that doesn't break
For class projects, functional is fine. For client deliverables, polished matters.
Features#
Free alternatives don't include:
- True Mekko charts (virtually impossible without add-ins)
- Automatic agenda slides
- Smart chart layouts
- Variance waterfall subtypes
- Full Excel data binding
If you specifically need Mekko charts, you need a paid tool. There's no free workaround that produces professional results.
Support and Updates#
Free tools offer limited support. When something breaks before a client presentation, you're on your own. Paid tools provide:
- Technical support when issues arise
- Regular updates and bug fixes
- Compatibility updates for new Office versions
The Real Cost of "Free"#
Here's a perspective shift: free software isn't actually free. You pay with time instead of money.
Scenario 1: Native PowerPoint
You spend 15 minutes building a waterfall chart that Think-cell or Deckary would create in 45 seconds. If you value your time at $25/hour (a conservative student rate), each manual waterfall costs $6.25 in time.
Build 10 waterfall charts per year: $62.50 in time costs.
For $49/year, Deckary eliminates that time cost entirely—and you get a better chart.
Scenario 2: Fighting with Excel Links
Native PowerPoint's Excel linking breaks frequently. You spend 20 minutes troubleshooting why your chart shows old data. Dedicated tools with proper data binding don't have this problem.
Each debugging session costs time you could spend on analysis.
The calculation:
If a paid tool saves you more than its cost in time, the "free" alternative is actually more expensive.
At $49/year for Deckary:
- Saves 2 hours annually? That's $25/hour value
- Saves 5 hours annually? That's $10/hour value
- Saves 10 hours annually? That's $5/hour value
Even at student wages, the math favors budget tools over truly free options for regular use.
Getting Started: Step-by-Step#
If You Choose Native PowerPoint#
- Learn the stacked bar waterfall workaround (YouTube tutorials exist)
- Create a template file with pre-formatted chart styles
- Accept that Mekko charts aren't happening
- Build extra time into your workflow for manual formatting
If You Choose Power-user (Academic)#
- Apply with your academic email at Power-user's website
- Download and install the add-in
- Explore the template library—it's genuinely useful
- Practice with the waterfall chart feature before you need it for real
If You Choose Deckary#
- Start the 14-day free trial (no credit card required)
- Build a waterfall chart with your actual data
- Test the Excel linking with a real spreadsheet
- Compare the output quality to what you'd build manually
- Subscribe at $49/year if it fits your workflow
If You're Applying for Think-cell Academic#
- Start early—the institutional approval process takes time
- Contact your IT department or career services about the link requirement
- Check if other students at your institution already have Think-cell (the link may already exist)
- Have a backup plan in case the application doesn't work out
Summary#
Key takeaways:
- Think-cell offers free academic licenses — but requires institutional cooperation
- Power-user has simpler free academic licensing — apply with your .edu email
- Native PowerPoint works for basic charts — but waterfall and Mekko charts are painful
- Excel charts are underutilized — consider building in Excel and pasting to PowerPoint
- Deckary at $49/year is the best budget option — consulting-grade charts at one-sixth Think-cell's price
- "Free" has hidden time costs — calculate whether your time is worth more than $49/year
The right choice depends on your specific situation:
- Students: Apply for academic licenses first; use Power-user or Deckary as backups
- Freelancers: Start with Deckary's free trial; the $49/year investment likely pays for itself
- Early-career professionals: Don't suffer with manual charts; budget tools exist for your situation
You don't need to spend $299/year to create professional charts. But you also don't need to spend 15 minutes manually building every waterfall chart. The middle ground—budget tools like Deckary—exists specifically for students and freelancers who need professional output without enterprise pricing.
Build consulting slides in seconds
Describe what you need. AI generates structured, polished slides — charts and visuals included.
Try Free