5 Mekko Graphics Alternatives in 2025: Cheaper Options Compared
Looking for Mekko Graphics alternatives? Compare 5 options for creating Marimekko and waterfall charts in PowerPoint. Find tools that cost 70% less.
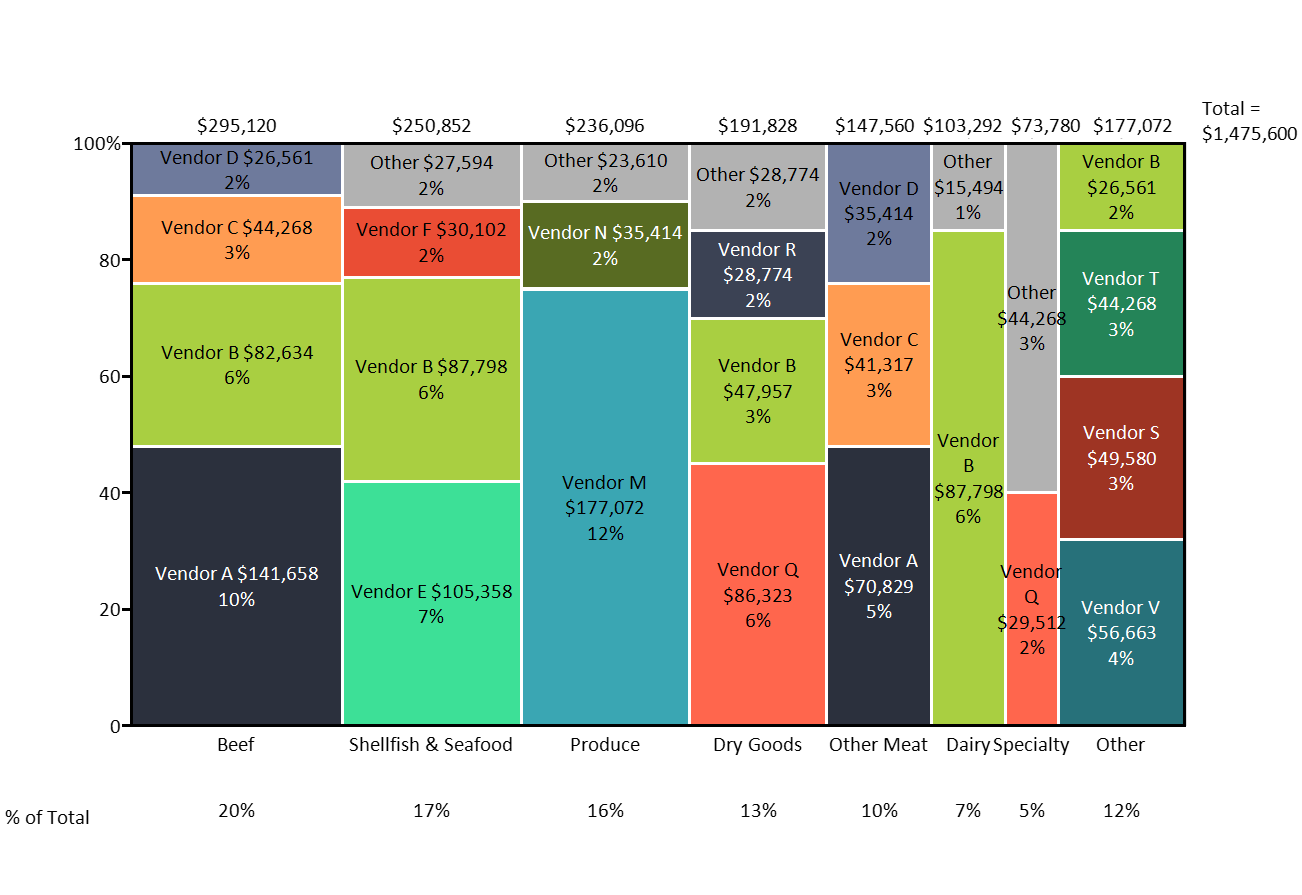
Mekko Graphics is a PowerPoint add-in that specializes in Marimekko charts—the variable-width bar charts used for market sizing and share-of-wallet analysis. At $399 per user per year, it's a premium tool that does one thing well.
If you're looking for alternatives, you're likely concerned about the price-to-usage ratio (paying $399/year for a tool used twice monthly), the lack of productivity features beyond charting, or whether newer options now offer the same capabilities for less.
This guide compares five alternatives based on three months of hands-on testing with real consulting workflows.
What Is Mekko Graphics?#
Mekko Graphics is a PowerPoint add-in that specializes in Marimekko charts (also called Mekko charts) and other business visualization tools. Founded in 2007 and now owned by insightsoftware, it's been a go-to solution for consultants who need variable-width bar charts.
Core capabilities:
- Marimekko charts — Variable-width bars showing size and composition
- Waterfall charts — Bridge charts with automatic connectors
- Bar Mekko charts — Horizontal variable-width bars
- Stacked charts — Standard and 100% stacked variations
- Excel linking — Charts update when data changes
Mekko Graphics excels at one thing: making variable-width charts easy. If you've ever tried to build a market share visualization where bar widths represent market size and segments show composition, you understand the pain this solves.
Why Look for Mekko Graphics Alternatives?#
Based on search patterns and conversations with consultants who've switched:
1. Price ($399/year per user)
At $399/year, Mekko Graphics costs more than many productivity suites. For a team of 10, that's nearly $4,000 annually for charting alone. Freelancers and small teams feel this most acutely.
2. Limited scope
Mekko Graphics focuses narrowly on charting. There are no keyboard shortcuts for alignment, no icon libraries, no templates. You're paying premium prices for a single-purpose tool.
3. No productivity features
Unlike broader add-ins, Mekko Graphics doesn't help with the 80% of slide work that isn't charting—aligning objects, inserting icons, formatting text.
4. Occasional use cases
Many consultants build Mekko charts for specific deliverables (market sizing, competitive analysis) but don't need specialized charting daily. The annual subscription doesn't scale down for light usage.
5. Better alternatives exist
Tools like Deckary now offer the same core charts at 70% less cost, plus features Mekko Graphics doesn't provide.
How We Tested These Alternatives#
We evaluated each Mekko Graphics alternative over three months using real consulting workflows:
- Charts built: 20+ Marimekko and waterfall charts per tool
- Data complexity: Excel datasets from 10 to 5,000 rows
- Platforms tested: Windows 11 and macOS Sonoma
- Use cases: Market sizing, share-of-wallet, financial bridges, segment analysis
We scored each tool on chart quality, ease of use, Excel integration, price, and additional features.
5 Mekko Graphics Alternatives Compared#
1. Deckary — Best Overall Value#
Price: $119/year or $199 lifetime | Website: deckary.com
Deckary combines the charting capabilities consultants need with productivity tools that speed up everyday slide work. It's what we wish Mekko Graphics included from the start.
Charting features:
- Marimekko charts with variable-width bars
- Waterfall charts with automatic bridges and subtotals
- Gantt charts with milestones and dependencies
- Stacked bar and column charts
- All charts link to Excel with automatic updates
Productivity features included:
- 20+ keyboard shortcuts for alignment and distribution
- 600+ professional icons (business, technology, healthcare, finance)
- AI text polish for slide copy
- Consulting-grade templates
- Full Mac and Windows support
What we liked:
- Same Mekko chart quality at 70% less cost
- Shortcuts alone save 30+ minutes per deck
- Icon library eliminates stock photo searches
- Lifetime license means no recurring fees
What's missing:
- Fewer chart variations than Mekko Graphics (no bubble Mekko, for example)
- Newer product with less enterprise track record
Verdict: Best value for consultants who need Mekko charts plus productivity features. The $280/year savings over Mekko Graphics pays for itself immediately—and you get shortcuts, icons, and AI included.
2. Think-cell — Best for Enterprise Teams#
Price: $299+/year | Website: think-cell.com
Think-cell is the industry standard at MBB firms and investment banks. If your company already has licenses, there's little reason to switch.
What it offers:
- Marimekko charts
- Waterfall charts with extensive customization
- Gantt charts and process flows
- Automatic agenda slides
- Harvey balls and other consulting visuals
Pros:
- Trusted by McKinsey, BCG, Bain, Goldman Sachs
- Deepest chart customization options
- Strong IT and enterprise support
- Automatic slide numbering and agendas
Cons:
- Still expensive ($299+/year)
- No keyboard shortcuts for alignment
- No icon library
- Steep learning curve for new users
- Complex for occasional use
Verdict: If your firm provides Think-cell, use it. But if you're paying out of pocket, Deckary offers similar charts at 60% less with shortcuts and icons included.
3. PowerPoint Built-in Charts — Best for Simple Needs#
Price: Included with Microsoft 365
PowerPoint's native charting has improved significantly. For basic needs, it might be enough.
What it offers:
- Stacked bar and column charts
- Basic waterfall charts (since Office 2016)
- Combo charts
- Standard formatting options
Pros:
- Free with Microsoft 365
- No additional software to learn
- Familiar interface
- Good enough for simple visualizations
Cons:
- No true Marimekko charts (can't vary bar widths)
- Waterfall charts require manual formatting
- Limited customization for consulting-grade output
- Time-consuming for anything complex
Verdict: Suitable for occasional, simple charts. Not practical for market sizing, competitive analysis, or regular consulting work where you need variable-width bars.
4. Excel Charts (Exported to PowerPoint) — Best for Excel Power Users#
Price: Included with Microsoft 365
You can build Mekko-style charts in Excel using stacked area charts with creative data manipulation, then paste into PowerPoint.
What it offers:
- Complete flexibility (if you know the tricks)
- Any visualization Excel supports
- Native Microsoft format
Pros:
- Free with Microsoft 365
- Full control over every element
- No learning curve for Excel experts
Cons:
- Very time-consuming (30-60 minutes per Mekko chart)
- Requires workarounds and formula gymnastics
- Difficult to update when data changes
- Charts often break when pasted into PowerPoint
- Not practical for regular use
Verdict: A fallback option for one-off charts, not a real alternative. The time cost makes this impractical for anyone building Mekko charts regularly.
5. Zebra BI — Best for Power BI Users#
Price: $28/month ($336/year) | Website: zebrabi.com
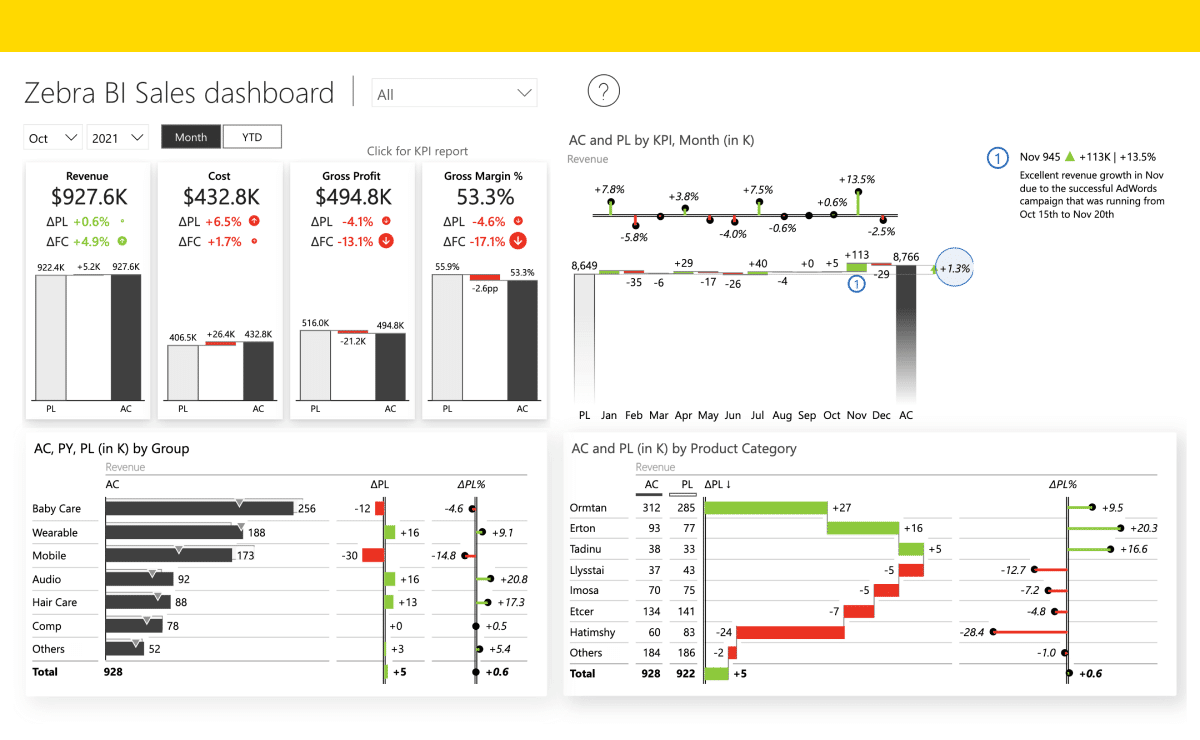
Zebra BI specializes in IBCS-compliant charts for financial reporting and business intelligence.
What it offers:
- Waterfall and variance charts
- IBCS-standard formatting
- Power BI integration
- Excel add-in for financial charts
Pros:
- Excellent for CFO presentations and financial reporting
- IBCS compliance for standardized visuals
- Strong Power BI and Excel integration
- Good for variance analysis
Cons:
- No Marimekko charts
- More expensive than Deckary ($336/year)
- Focused on BI, not consulting workflows
- Overkill for occasional charting
Verdict: Best for finance teams using Power BI who need IBCS-compliant charts. Not ideal for market sizing or consulting-style Mekko visualizations.
Continue reading: Bullet Charts in PowerPoint · Duplicate Shortcut in PowerPoint · Deloitte Presentation Template
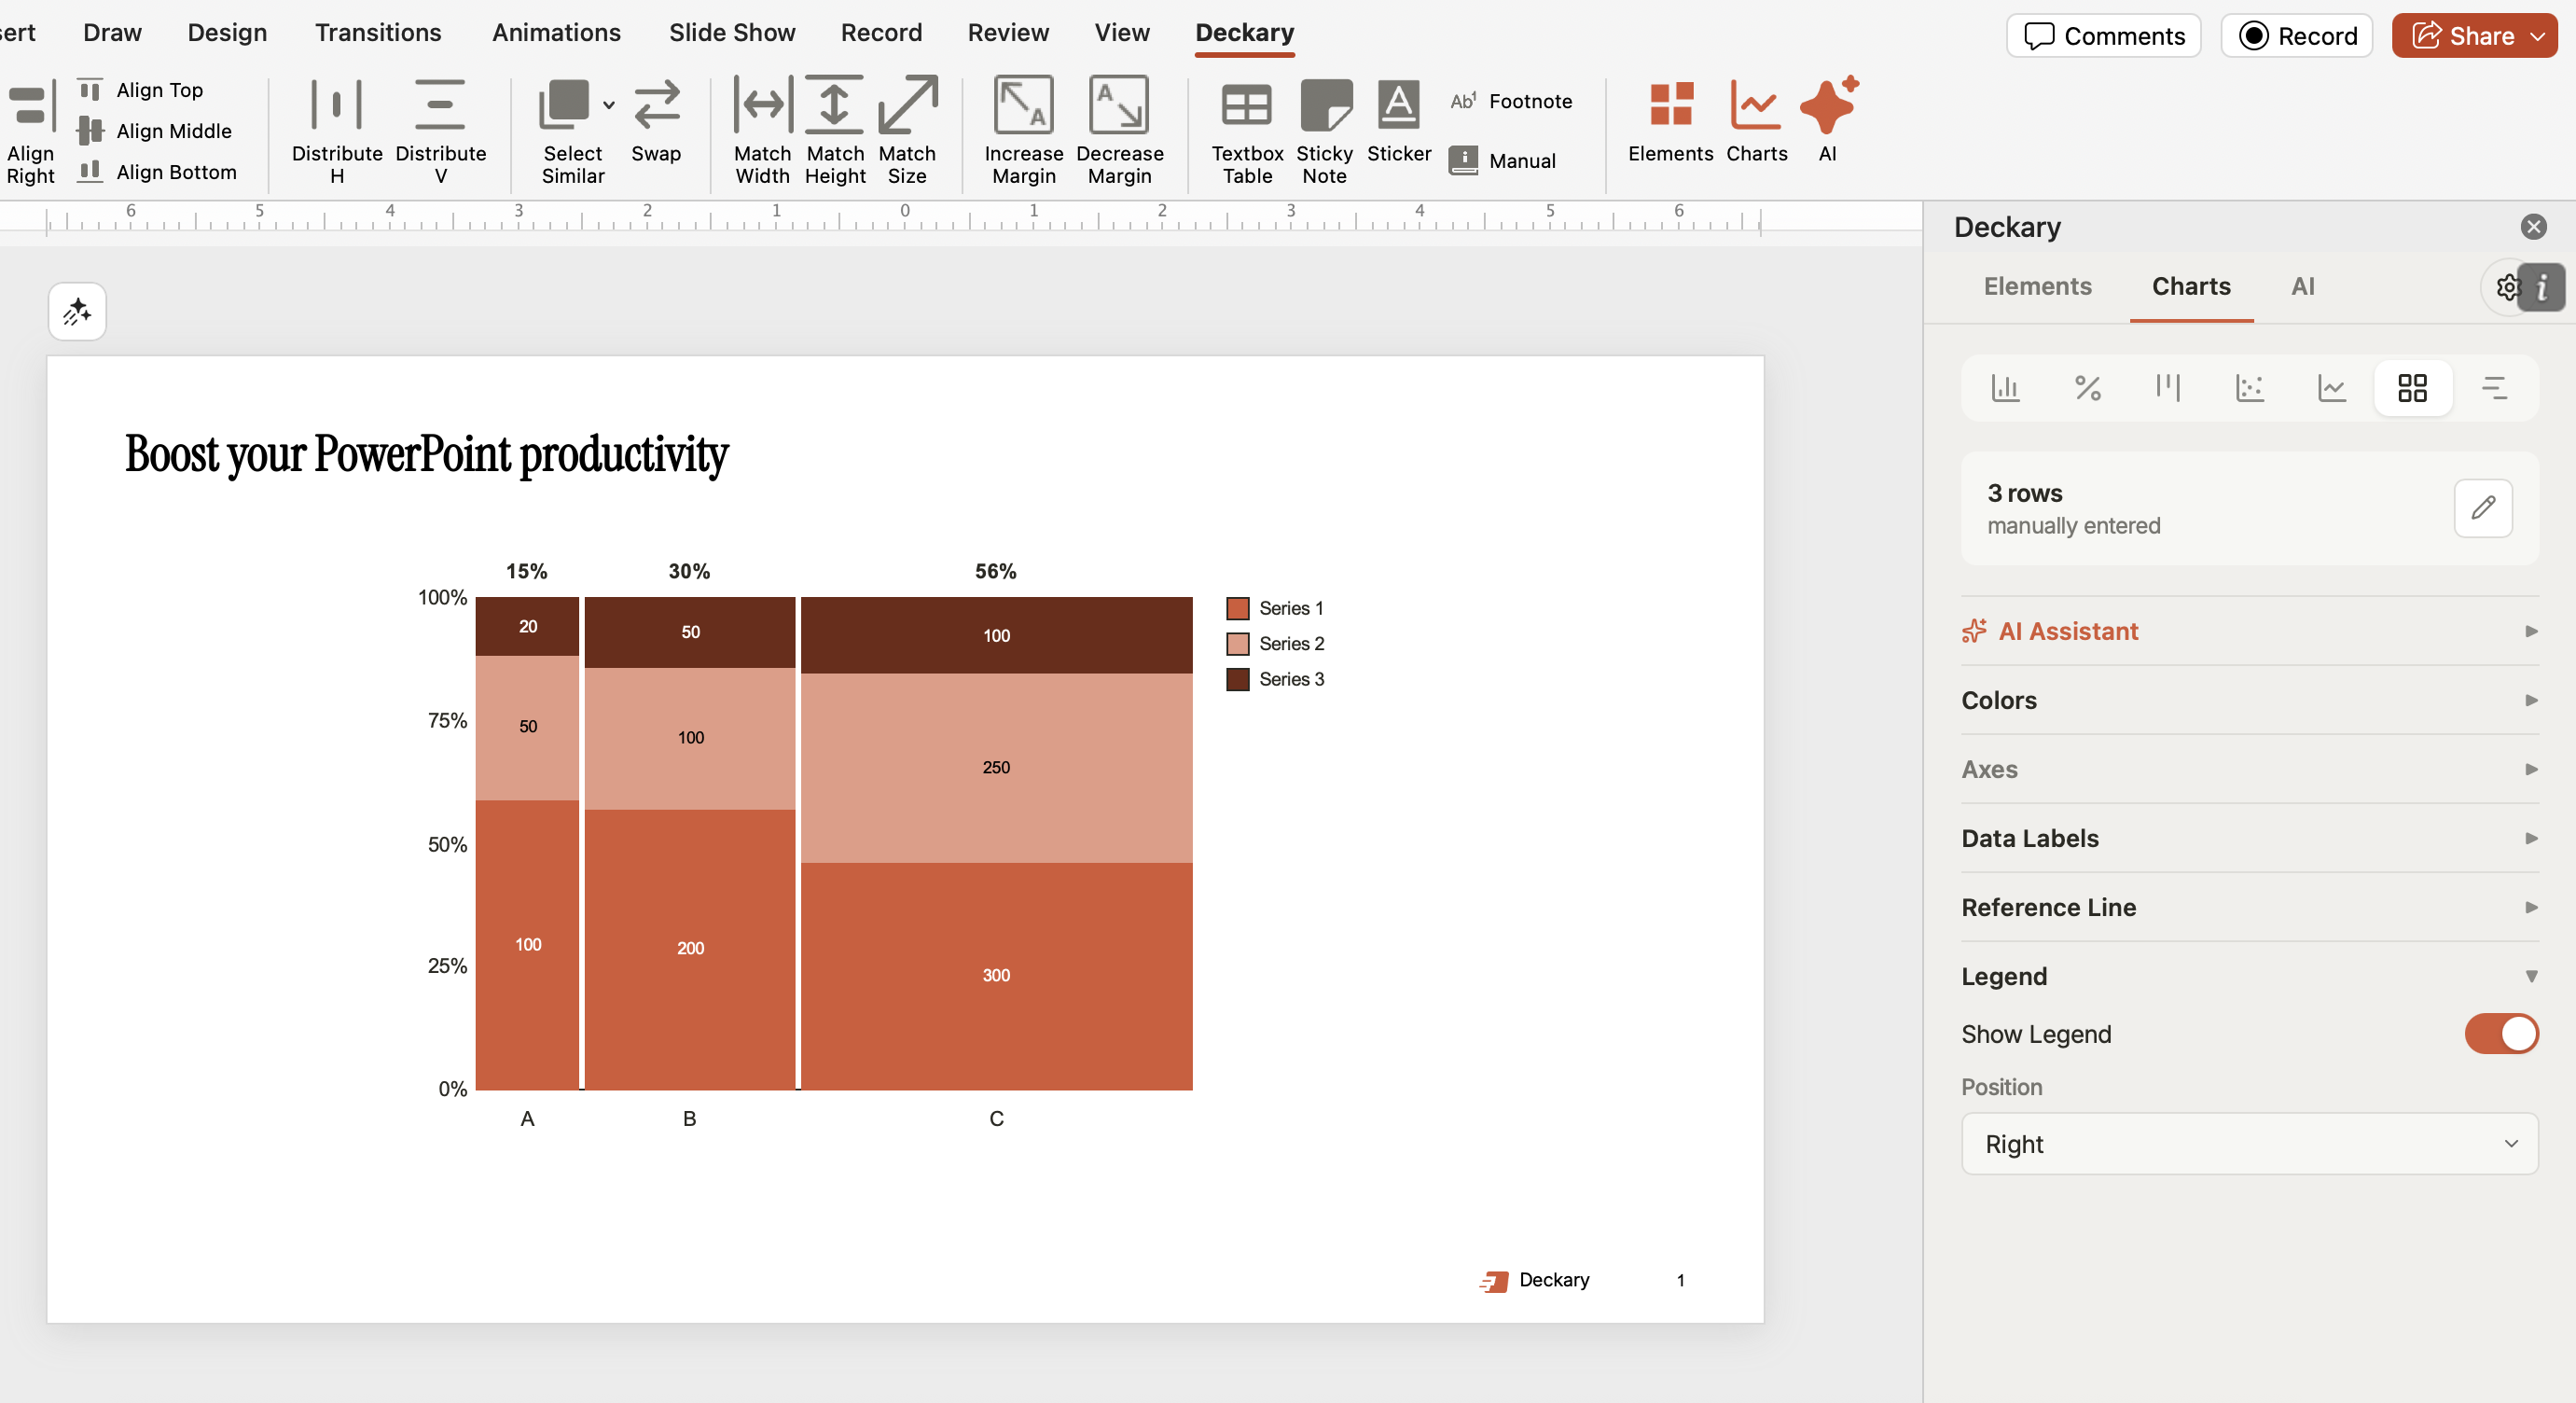
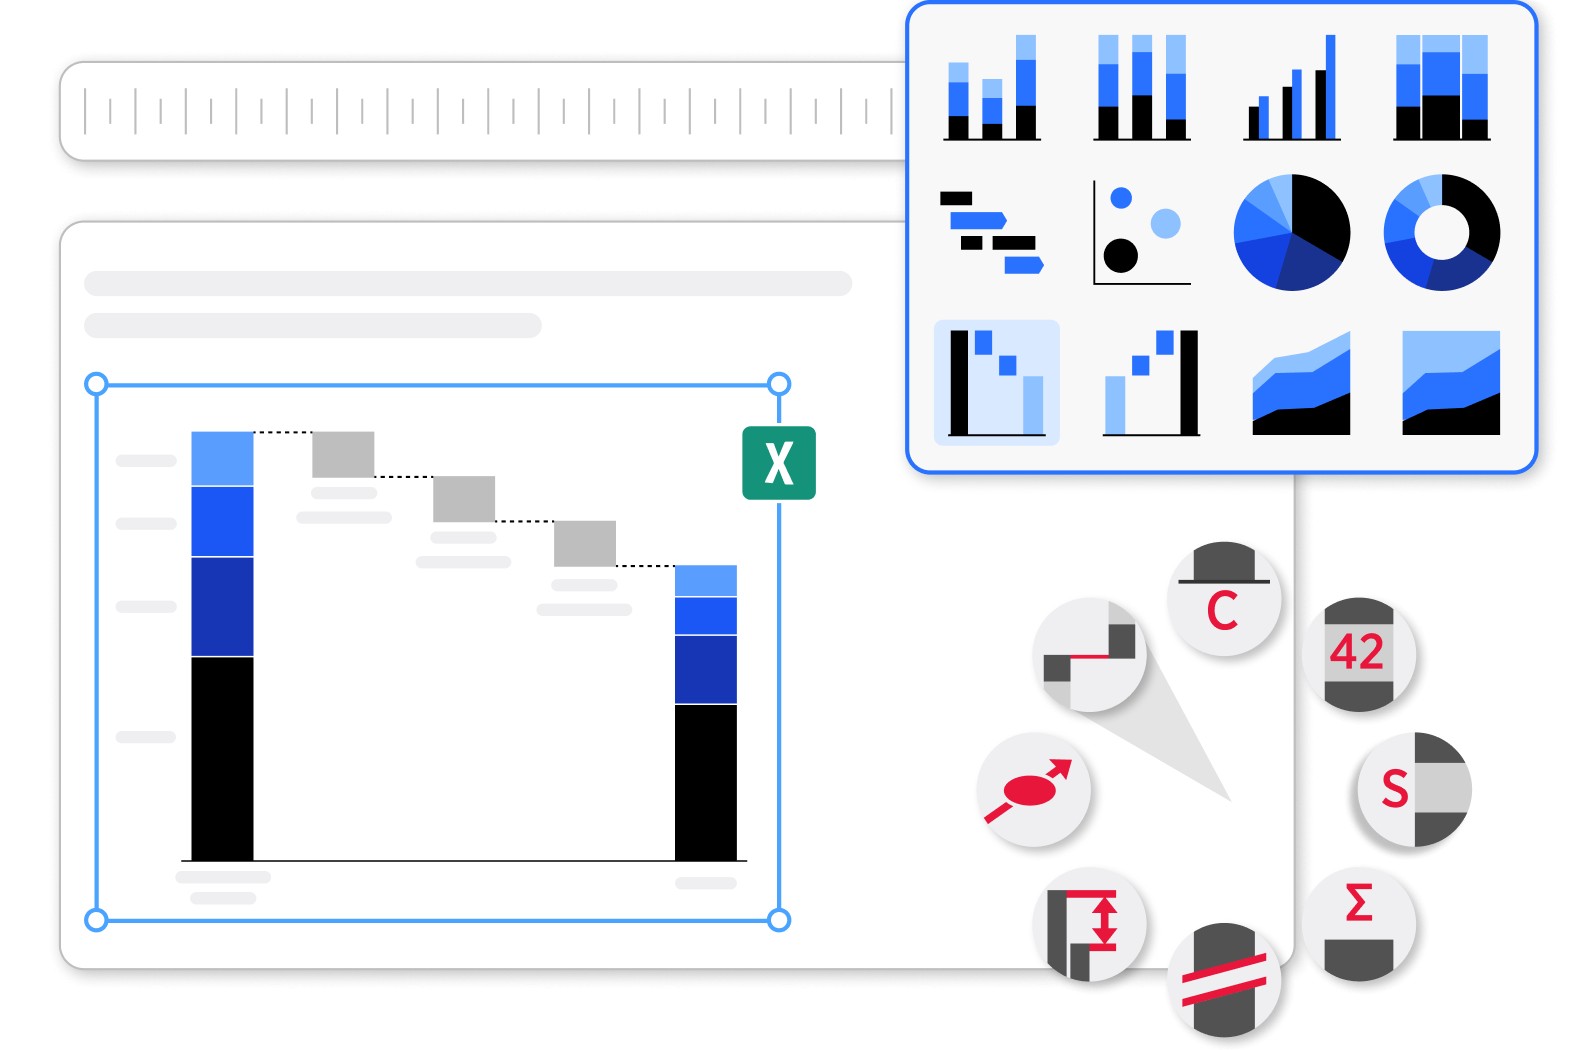
Build consulting slides in seconds
Describe what you need. AI generates structured, polished slides — charts and visuals included.
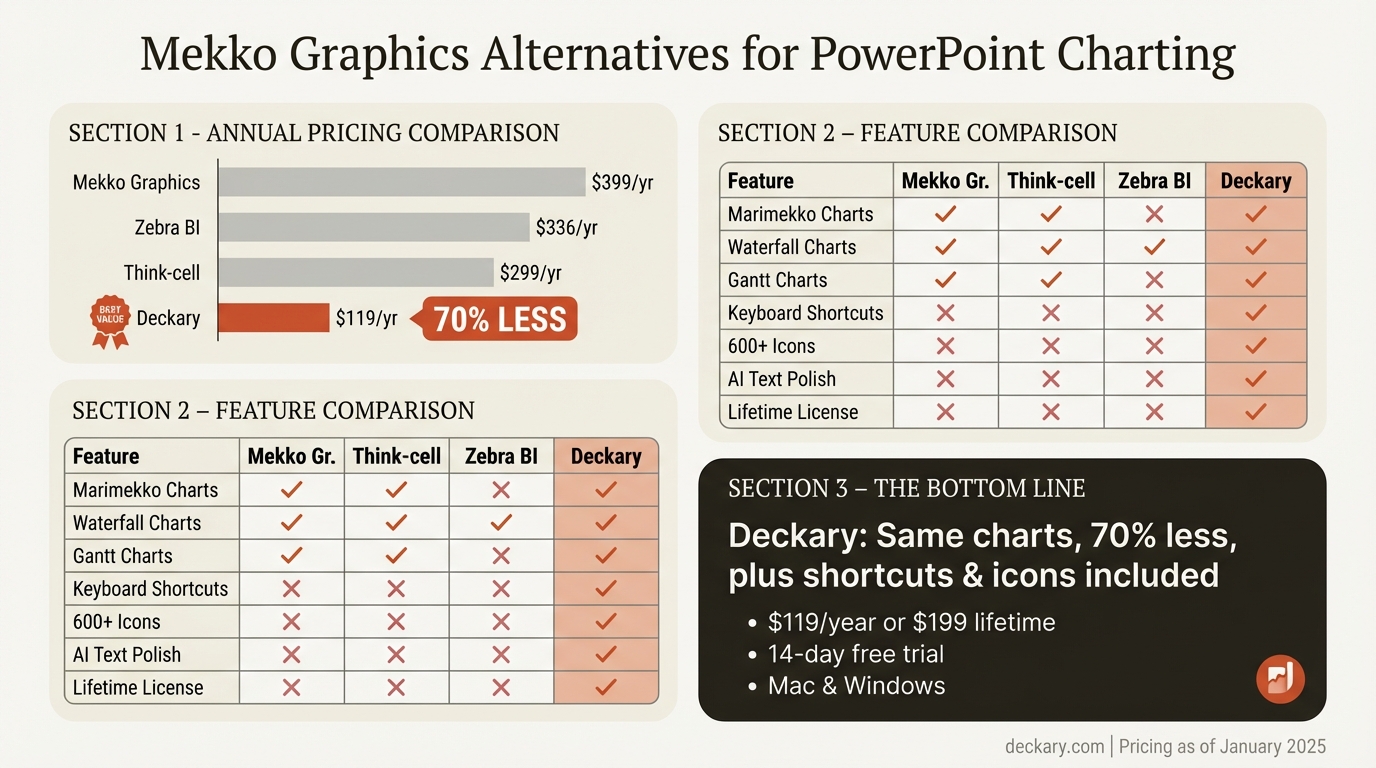
Feature Comparison Table#
| Feature | Deckary | Mekko Graphics | Think-cell | PowerPoint | Zebra BI |
|---|---|---|---|---|---|
| Price/year | $119 | $399 | $299+ | Free | $336 |
| Marimekko charts | Yes | Yes | Yes | No | No |
| Waterfall charts | Yes | Yes | Yes | Basic | Yes |
| Gantt charts | Yes | Yes | Yes | No | No |
| Excel linking | Yes | Yes | Yes | Limited | Yes |
| Keyboard shortcuts | 20+ | No | No | Limited | No |
| Icons included | 600+ | No | No | Basic | No |
| AI features | Yes | No | No | Copilot | No |
| Lifetime option | $199 | No | No | N/A | No |
| Mac support | Full | Full | Full | Full | Limited |
When to Choose Each Alternative#
Choose Deckary if:#
- You want Mekko charts at 70% less cost than Mekko Graphics
- You value shortcuts, icons, and AI features
- You're a freelancer or paying out of pocket
- You want a one-time lifetime license option
- You need full Mac and Windows support
Choose Think-cell if:#
- Your firm already provides enterprise licenses
- You need automatic agenda slides
- You build complex charts daily with deep customization
- Enterprise IT support is important
Choose PowerPoint/Excel if:#
- You only create 1-2 simple charts per month
- Budget is your absolute primary constraint
- You have time for manual formatting
- You don't need variable-width Marimekko bars
Choose Zebra BI if:#
- You work primarily in Power BI
- You need IBCS-compliant financial charts
- Market sizing and Mekko charts aren't your focus
- You're building CFO dashboards
What Mekko Graphics Does Better#
To be fair, Mekko Graphics isn't without advantages:
More chart variations: Mekko Graphics offers bubble Mekko charts, area Mekko charts, and other specialized variations that alternatives don't always match.
20+ years of refinement: Since 2007, they've polished edge cases and enterprise workflows that newer tools are still catching up on.
Deep customization: Power users who need granular control over every chart element may find Mekko Graphics more flexible.
Enterprise track record: Large organizations with strict IT requirements may prefer Mekko Graphics' established security and compliance documentation.
If you build specialized Mekko chart variations daily and need every option available, the $399/year premium may be worth it.
The Real Cost Calculation#
Let's break down the numbers for a team of 5 consultants:
| Tool | Annual Cost (5 users) | 3-Year Cost | Features Included |
|---|---|---|---|
| Mekko Graphics | $1,995 | $5,985 | Charts only |
| Think-cell | $1,495+ | $4,485+ | Charts + agendas |
| Deckary | $595 | $1,785 | Charts + shortcuts + icons + AI |
| Deckary Lifetime | $995 (once) | $995 | Everything, forever |
With Deckary's lifetime license, a team of 5 pays $995 once and never pays again. That's less than one year of Mekko Graphics.
How to Switch from Mekko Graphics#
If you're currently using Mekko Graphics and considering a switch:
1. Export your chart data
Mekko Graphics charts link to Excel. Your data is already in spreadsheets—the charts themselves are just visualizations.
2. Trial alternatives with real projects
Don't evaluate tools with sample data. Use your actual market sizing or financial bridge projects to see how alternatives perform.
3. Test the learning curve
Most consultants can build their first Mekko chart in Deckary within 10 minutes. The interface is intentionally similar to what you already know.
4. Evaluate total productivity
A tool that costs less AND adds shortcuts, icons, and AI may deliver more value than a premium single-purpose charting add-in.
The Bottom Line#
Mekko Graphics pioneered Marimekko charting in PowerPoint, and for specialists who need every chart variation, it remains a solid choice.
But for most consultants, analysts, and corporate strategists:
- Deckary offers the same core charts at 70% less cost, with shortcuts, icons, and AI included
- Think-cell is worth it if your firm already pays for it
- PowerPoint alone works for occasional, simple needs that don't require variable-width bars
If you're evaluating options, try Deckary free for 14 days. No credit card required. Build the same Marimekko and waterfall charts you're creating now—at a fraction of the cost.
Build consulting slides in seconds
Describe what you need. AI generates structured, polished slides — charts and visuals included.
Try Free